
Networks and their analysis is one of the core topic of this course for network analysis can prove useful and powerful in various fields such as biology, psychology, computer sciences, social sciences, etc. During the lectures, we saw how network analysis on Facebook data (or any other social media platform) to can help us gain knowledge about friendships and characteristics of social circles on the platforms. We also saw how networks and strong/weak ties can provide us with meaningful insights on job searching/hunting. These are just few of the many uses and applications of the network analysis. Through this blog, I would like to share an interesting application of network analysis which I came across. It is “Combining network analysis with epidemiological data to inform risk-based surveillance: Application to hepatitis E virus (HEV) in pigs.”
This interesting research was conducted by Morgane Salines, Mathieu Andraud and Nicolas Roseab. The goal of the research was to “evaluate the impact of animal movements on pathogen prevalence in farms and assess the risk of local areas being exposed to diseases due to incoming movements (the transportation)” and they combined Network Analysis with epidemiological data to achieve the same. They collected data consisting of pig moments from farms, slaughterhouses, etc. for the period of a year (January – December 2013) from the French Ministry of Agriculture.
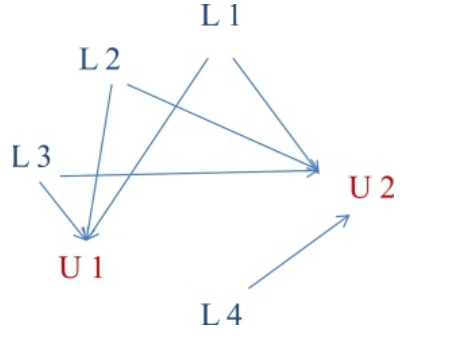
Now comes the interesting part of how they designed or defined a network or a graph. They modelled the data into directed networks which were aggregated on the data for the entire year. The nodes of the network represented the pig holdings, i.e. the farms, slaughterhouses, trade plants, etc, while the movements (all the transportations) between them were represented as directed links. They then calculated various centrality measures such as in-degree, out-degree, betweenness, etc for 178 farms. The graph below shows a sample network where U stands for Unloading pigs and L for loading pigs.
After the preliminary work was finished, the researches then conducted “a univariable analysis to assess the statistical link between each explanatory variable (i.e. the farms’ centrality metrics) and the outcome (i.e. the unbiased within-farm HEV seroprevalence).” PS – HEV seroprevalence was defined as the “number of HEV-seropositive pigs in relation to the total number of pigs sampled in the farm.” After this analysis, they successfully plotted the risk indicator for each of the French departments which looked like this.
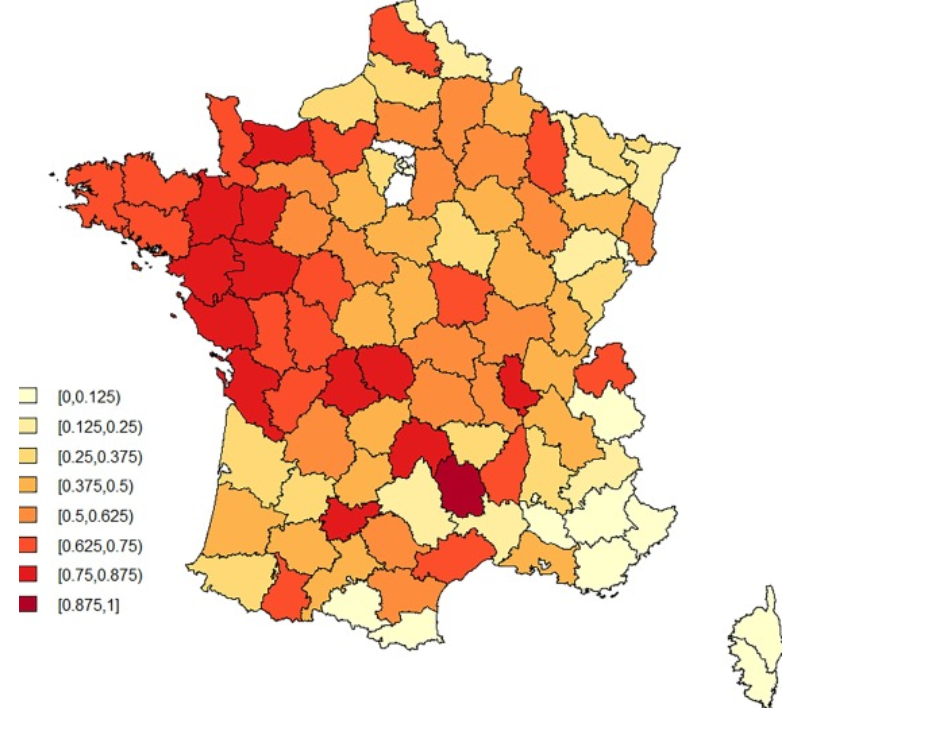
Thus, it can be concluded that simple network (and statistical) analysis along with epidemiological data can effectively help the surveillance programs by indicating the risk and thus helping prevent diseases. The network they modeled was very simple and was something that we learnt in the C46 class.
REFERENCE –
MorganeSalinesab, MathieuAndraudab, & NicolasRoseab. (2017, November 20). Combining network analysis with epidemiological data to inform risk-based surveillance: Application to hepatitis E virus (HEV) in pigs. Retrieved from https://www.sciencedirect.com/science/article/pii/S0167587717305937.