One of the key ideas of has been about approaching analyzing networks as it pertains to things spreading within them. Most notably, understanding social networks can be key to understanding infection and how to deal with it. When we consider properties of graphs such as clustering coefficients, we can apply this knowledge to recognize an outbreak and control spread. However, infection is not limited to people. For example, we read in the blog post Compromised Networks about the malware known as Nodersok/Divergent and ways of preventing network attack by considering the SCCs within the network. Just as important as prevention is detection. We discuss two different graph-theoretical approaches to understand malicious code, one focused on botnet network behaviour and the other focused on code similarity.
One approach using graph-analysis from Šmolík inspects botnets specifically and how they communicate in a network, since botnets are a collection of computers controlled by the creator of malware. The leaving communication of a host is represented as a directed graph. Each vertex is an identifying triplet of (IP address, port, protocol) with a directed edge (i,j) if j was the first connection of the host after connecting to i. One of the key identifying features of suspicious code is the presence of more cycles, since attempts to communicate between a bot and its command and control server. Other notable properties in the graph of communications of infected networks include just the number of nodes in the graph, since the botnet is spreading itself much more than the average program would.

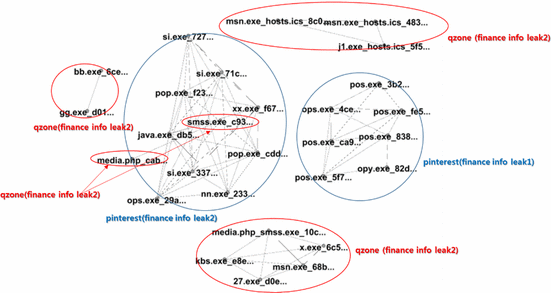
Another way of detecting malicious software is by determining their similarity in code to other software, shown in Lee, Taejin, et al. This works by creating a weighted graph where each node is some malicious software and each edge is weighted by similarity. Then, by determining clustering coefficients, we use agglomerative clustering to create communities of malware if they reach a given threshold for local similarity. This type of detection is important not only to know when you have malware on your system but determining similarity can also determine the behaviour of the given virus to prevent further spread.

References
Šmolík, Daniel. “Graph-Based Analysis of Malware Network Behaviors.” Graph-Based Analysis of Malware Network Behaviors, Czech Technical University in Prague. Computing and Information Centre, May 2017, core.ac.uk/display/84833006.
Lee, Taejin, et al. “Automatic Malware Mutant Detection and Group Classification Based on the n-Gram and Clustering Coefficient.” The Journal of Supercomputing, vol. 74, no. 8, 2015, pp. 3489–3503., doi:10.1007/s11227-015-1594-6.
