
In class we have discussed many properties of graphs including clustering, graph connectivity, and degree centrality and connectedness. In this blog I will outline the real world use of these properties in stock market analysis.
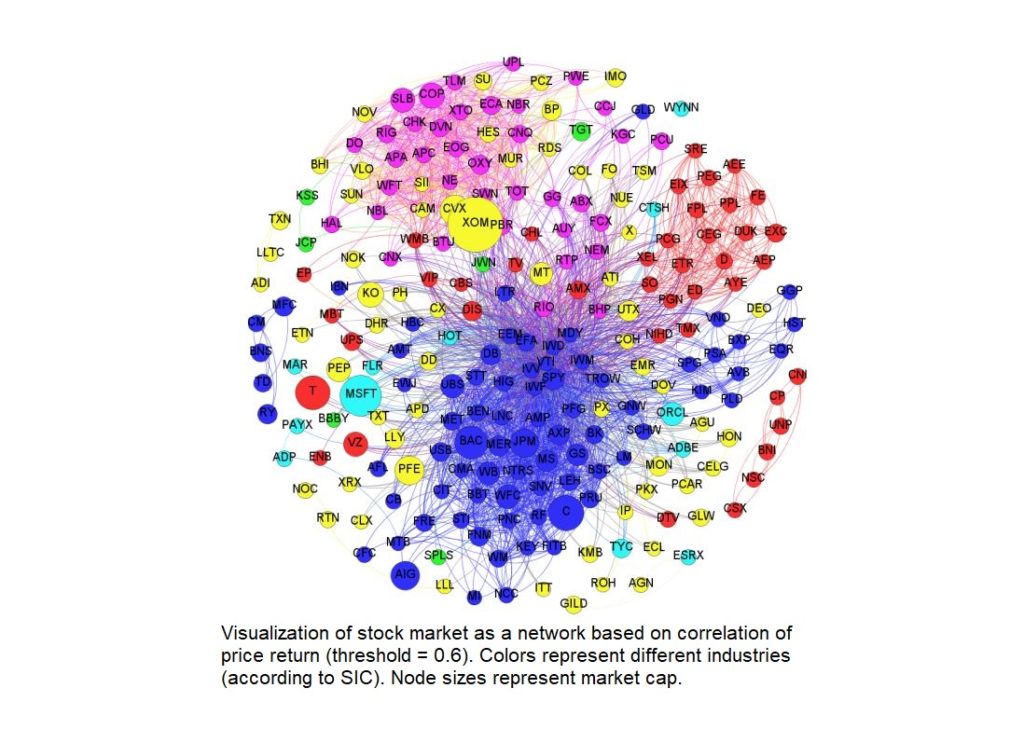
There have been many attempts to “beat” the stock market for obvious reasons ($). Traditional approaches such as technical and fundamental analysis have their believers and critics. Another approach, based on graph theoretical analysis, is also used in risk analysis and portfolio management. By nature the stock market is correlated because we live in a global economy — no company is isolated. Thus stock markets can be represented as a cluster of companies with edges forming between companies sharing a characteristic. Here we focus on the representation of the stock market as a network based on correlated stock returns. That is, If the absolute difference between the return of two stocks is less than some defined threshold theta, an edge is formed between them.
An interesting result is that after applying community detection algorithms on such a network (such as the Girvan-Newman algorithm as discussed in class), the resulting clusters were consistent with the market classifications as denoted by the Standard Industrial Classification (SIC) system; a classification of industries by 4-digit code. This illustrates that stocks within similar sectors tended to perform similarly. In class we refered to this as communities sharing the same behaviors or “birds of a feather are alike”. Using software to visualize stock return correlations offers an intuitive way to analyze the overall structure of a set of stocks, and to helps to identify key companies/market clusters — this is an important aspect of risk analysis/portfolio management.
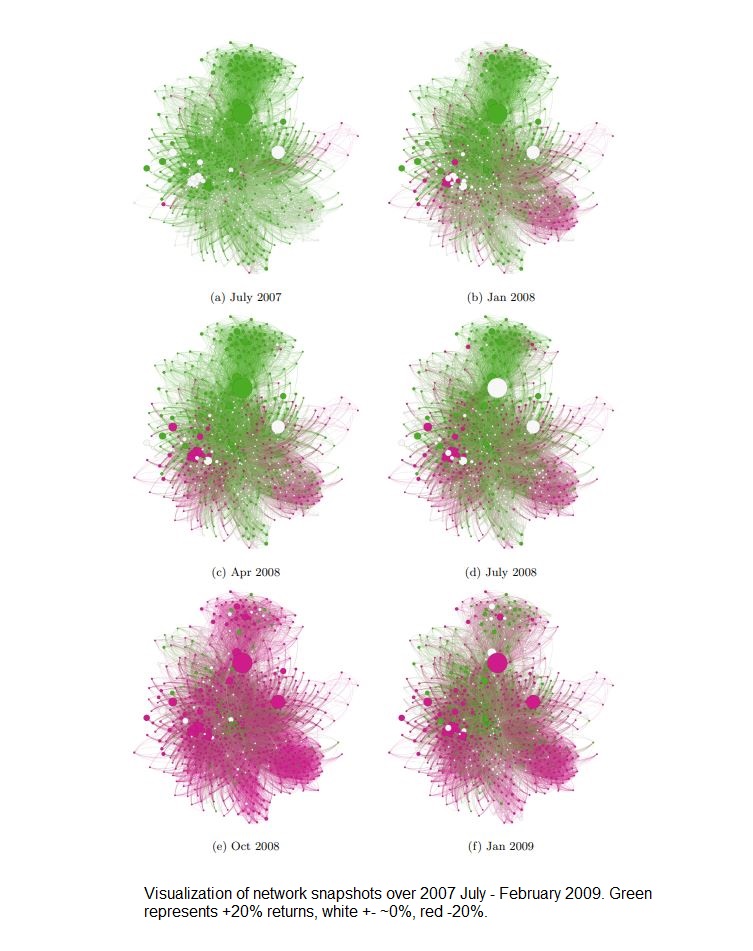
This networking model can be applied to stocks listed on the S&P 500 based on rate of return over the time frame July 2007 – February 2009. Snapshots of the network can be taken at smaller time frames i.e July 2007 – August 2007, August 2007 – September 2007, etc. to produce a series of networks depicting the progression of correlation between companies. The interesting result is that looking at the series of networks, you can observe a ‘cascading’ or spreading effect of returns in clusters. This is similar to what we discussed about network security and the spread of malicious software. Thus this network representation of the stock market could be useful in systemic risk and cascade effects prediction.
Note: this time frame represents the approximate timeline of the US Financial Crisis in ’08
Why network analysis over traditional methods?
Traditional approaches tend to rely on statistical properties such as variance and expected returns over time. However these typically represent localized behavior of one or two stocks and do not represent the behavior of a cluster/community of stocks. A network representation that characterizes stocks in clusters of connected components (industries) gives insight to more macro properties of the market. Properties such as degree centrality and betweeness of a stock can be identified.
A practical example is if Apple (AAPL) suddenly loses 50% of its value: semiconductor, glass screen, and other electronic hardware companies will almost surely experience similar losses soon after in a cascading effect. Network analysis can help to identify these clusters.
Limitations
Note this doesn’t mean you can beat the market with network analysis. Limitations of network analysis are that it doesn’t actually quantify how to actually achieve a better portfolio. Yes it can tell you to diversify so that your portfolio isn’t comprised of stocks all from one cluster, but ultimately it does not consider how much of each stock, at what time frame, and at what prices would be optimal points of entry/exit. Perhaps network analysis properties such as stock connectedness could be used in conjunction with a neural network to formulate a quantitative approach to optimize some return function of dollars.
References
[1] Huang, Wei-Qiang, Xin-Tian Zhuang, and Shuang Yao. “A network analysis of the Chinese stock market.” Physica A: Statistical Mechanics and its Applications 388.14 (2009): 2956-2964.
[2] Sun et al., 2015. Sun, W., Tian, C., and Yang, G. (2015). Network analysis of the stock market.
[3] 许忠好, and 李天奇. “基于复杂网络的中国股票市场统计特征分析.” 山东大学学报 (理学版) 52.5 (2017): 41-48.
Photos courtesy of [2].