
Airlines fly to and from many places across the world. Most airlines have a headquarters, where most of their flights arrive and depart from. In 1993, there were eight major airlines operating in the United States. However, in 2015, only three of the original eight major airlines still exist, with a few new additions created along the way. The reason for the drop is that many airlines have merged together or ceased operations. The interesting part that will be shown in the following section is the effects that these mergers and closures have had on the maps of airline routes, in relation to graph theory. We will look at betweenness and degree specifically, as they relate to the topics covered in CSCC46.
Firstly, an airline route map can be represented using a graph connecting a flight from city A to city B using an edge. This representation will be used for the remainder of this blog post.
The below table shows the degree of the top 10 airports between 1990 and 2015. Recall, the degree represents the number of flights to and from an airport. Some observations can be made from the data below. Between 2000 and 2010, a major merger between Northwest Airlines and Delta occurred. CVG was Delta’s major hub before the merger, but around the time of the merge, many cuts were made due to financial troubles in both companies. This is reflected in the table below, as CVG is not present in the 2010 column, indicating the number of flights to and from CVG declined substantially as a result of the Delta merge.
We can also see an overall increase in the degree of each airport over time. This is attributed to more flight traffic, as well as airlines increasing the number of flight paths as mergers happen.
Top 10 airports by Standardized Degree, by year
| Rank | 1990 | 2000 | 2010 | 2015 | ||||
| 1 | ORD | 3.64 | ATL | 3.97 | ATL | 3.88 | ATL | 4.13 |
| 2 | ATL | 3.07 | ORD | 3.25 | ORD | 3.66 | ORD | 3.98 |
| 3 | DFW | 2.88 | DFW | 3.15 | DFW | 3.43 | DFW | 3.56 |
| 4 | PIT | 2.35 | IAH | 2.96 | DTW | 3.26 | CLT | 3.44 |
| 5 | STL | 2.21 | CVG | 2.77 | LAS | 2.87 | LAS | 2.82 |
| 6 | CLT | 2.20 | DTW | 2.63 | CLT | 2.85 | IAH | 2.80 |
| 7 | DEN | 1.99 | STL | 2.45 | IAH | 2.84 | DTW | 2.77 |
| 8 | DTW | 1.70 | CLE | 2.21 | DEN | 2.60 | DEN | 2.74 |
| 9 | MSP | 1.65 | EWR | 2.05 | MSP | 2.53 | MSP | 2.54 |
| 10 | IAD | 1.62 | MSP | 2.01 | MCO | 2.27 | PHL | 2.43 |
The next table shows the betweenness of the top 10 airports between 1990 and 2015. Recall, the betweenness of an airport is how much that airport is found on the shortest path between two other airports. Essentially this represents how much an airport is a flight hub (a major airport for flight connections). One major change that can be seen is the increase in betweenness of ATL between 1990 and 2000. This is attributed to ValueJet starting operations out of ATL as their main flight hub. Delta also massively expanded its operations in ATL to turn ATL into their hub. As expected, the top 3 airline hubs are present across most of the years from 1990 to 2015.
Top 10 airports by Standardized Betweenness, by year
| Rank | 1990 | 2000 | 2010 | 2015 | ||||
| 1 | ORD | 4.79 | ATL | 6.39 | ATL | 3.64 | ATL | 3.79 |
| 2 | ATL | 3.29 | DFW | 2.99 | ORD | 2.87 | ORD | 3.49 |
| 3 | SFO | 2.40 | DTW | 2.52 | DFW | 2.79 | DFW | 3.33 |
| 4 | DFW | 2.24 | IAH | 2.45 | LAS | 2.59 | CLT | 2.86 |
| 5 | PIT | 2.01 | ORD | 2.17 | IAH | 1.86 | LAS | 1.91 |
| 6 | CLT | 1.92 | CVG | 1.25 | DTW | 1.73 | IAH | 1.32 |
| 7 | DEN | 0.90 | STL | 0.92 | CLT | 1.62 | DEN | 0.74 |
| 8 | MSP | 0.88 | MSP | 0.81 | DEN | 0.77 | DTW | 0.74 |
| 9 | IAD | 0.83 | DEN | 0.75 | MSP | 0.71 | MSP | 0.68 |
| 10 | STL | 0.70 | LAX | 0.71 | SFO | 0.68 | PHL | 0.52 |
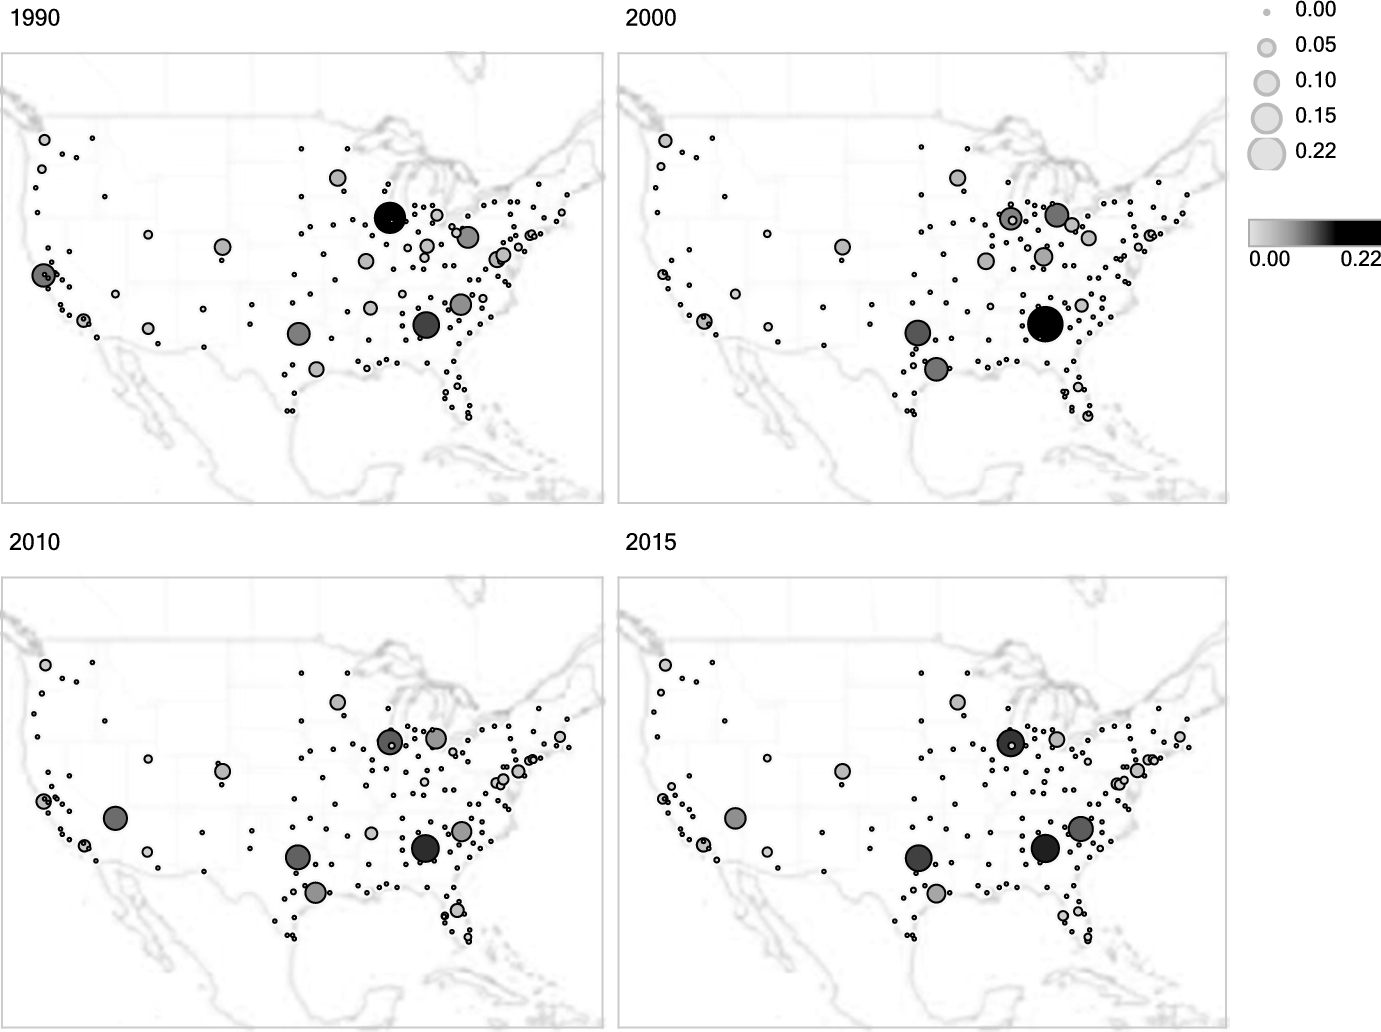
However, there is a slight decline in overall betweenness of the top 10 airports from 1990 to 2015. The reason for this is due to the creation of more mini flight hubs, and the expansion of flights across cities. This can be seen in the below graphic, as there are less larger circles and more medium sized circles, showing the creation of more mini flight hubs between 1990 and 2015.
In essence, the effects of creating, merging, and closing airlines is an interesting topic to look at from a graph theory perspective. We have seen how these effects change the degree and betweenness of airports in a flight path graph. This topic will be interesting to watch as more airlines are created, merged together, and shut down in future years.
References:
Ciliberto, F., Cook, E. E., & Williams, J. W. (2018). Network Structure and Consolidation in the U.S. Airline Industry, 1990–2015. Review of Industrial Organization, 54(1), 3–36. https://doi.org/10.1007/s11151-018-9635-y