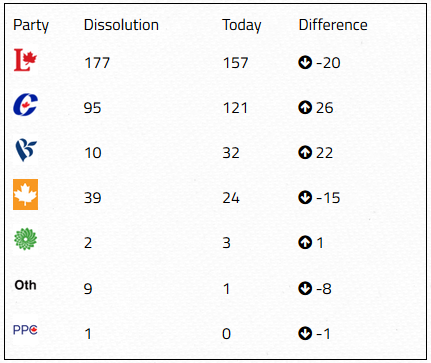
The recent Canadian Federal Election is an excellent example of the Balance Theorem at work, that is networks either contain only positive edges, or they are split into two factions. In Canadian Politics, this can be essentially seen as the Liberal vs Conservative divide with over 80% of the seats going to either the Liberal party or the Conservative party.
This split is not just limited to election results, our day to day lives exhibits this also. We tend to listen to those who form similar opinions with us and ignore or distance ourselves with those who disagree with us. This naturally leads to the state where each person is surrounded only with those they agree with, factions as seen in the Balance Theorem.
Ever wonder what it would be like to be related to royalty of ancient times past? What if I told you that if you’re European, then you’re related to King Charlemagne? Seems crazy, right? Well, lets examine an arbitrary person’s family tree. It would start with the person themselves, their 2 parents, 4 grand parents, etc… and resemble a complete binary tree. But if we think about this for a bit, we see that there is a bit of a contradiction. Going 30 generations back, so approximately 600 years if we assume a generation is approximately 20 years, a person would have 2^30 = 1,073,741,824 ancestors in that generation. But hold on! That is more than the number of people that would be alive in the whole world at that time, so what’s going on?
It turns out that our family trees aren’t just simple complete binary trees. The explanation lies in the fact that our family tree doesn’t have all unique ancestors, some ancestors take up multiple spots on the tree. This happens when parents of an ancestor are (knowingly or unknowingly) related to each other, which collapses the two parents’ family trees into a single tree.
This is known as pedigree collapse. After considering this, our family tree turns out to be a directed acyclic graph, since an individual cannot be their own ancestor, and a single ancestor can have multiple paths to the individual. How does this relate to King Charlemagne? Considering he lived from the years 742-814, there would have to have been a lot of pedigree collapse since no one individual could have distinct ancestors from those years until now. It was shown in 2013 by geneticists Peter Ralph and Graham Coop that all Europeans have the same common ancestors, going back around 1000 years. Thus all Europeans are related to King Charlemagne! Not only that, go back far enough and it is very likely that everyone is in some way related. It begs the question of how many degrees of separation there are between two individuals through their ancestry.
Countless device in our dailies lives use electricity. This number continues to increase as time passes by. To power these new devices we need ever more energy. The main source of electricity for the majority of devices is from a power grid. These massive physical networks can span across different countries and provide electricity for the majority of the world.
For a graph of a power grid we can take the … to be nodes and the cables between them to be edges. We can also measure the electrical current through an edge as the weight of that edge. We can use graph flow methods to measure the importance of different edges, and asses whether the given infrastructure is enough to handle the load. Occasionally there can be blackouts, which can occur as the result of some edge between two nodes being removed. Larger blackout can occur as the result of cascading failures occurring after several edges fail. These failures can result in increased flow on several edges, which may lead to these edges failing as well increasing the size of the blackout.
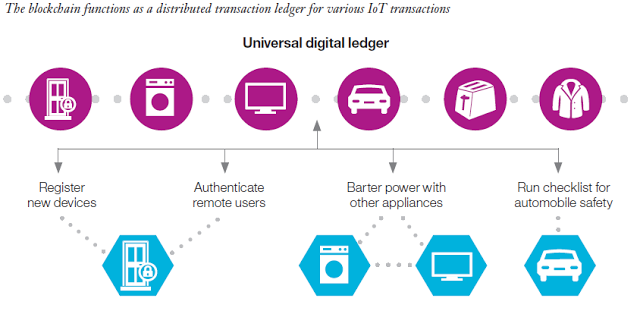
The Internet of Things(IoT) is a system relying on physical devices which, collecting information and sharing those information through the internet without any human efforts. Thanks to cheaper chips and the great power of internet, billions of physical devices around the world are able to be connected to the internet, as a result, IoT becomes more efficient.
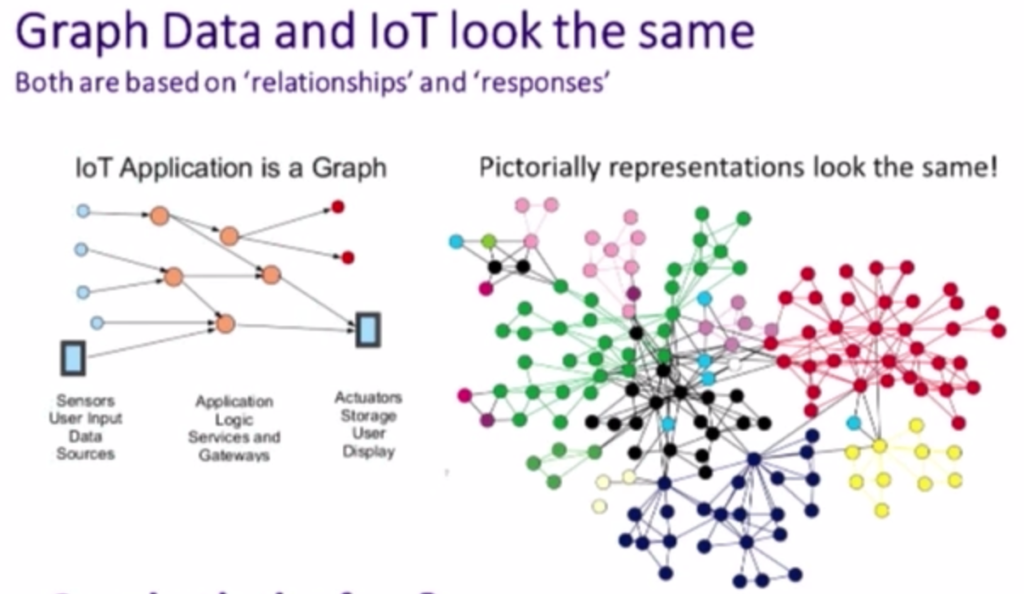
The network constructed by the IoT devices looks like the graphs above, and it has many paths inside the network. Every path starts from the user input data(data sources) and passes the application logic services and gateways(intermediate nodes). Finally, the information in the network reaches the storage and display stage (upper-level nodes). Overall, it is evident that IoT creates a network developed by hardware devices in an effective way. Since it does not require any manual work, it speeds up the transmission of information.
Some of my concerns is whether the fast-speed IoT be a potential threat to the public’s privacy and whether the information in the network is recorded without the public’s permission. The fact is that sensors in the network will collect some extremely sensitive data such as what you say and do in the private space. However, as many IoT devices cannot be patched effectively, they have become the target of many hackers. The hackers are now able to get private information from the device level, and the users’ information security is put in the weak position.
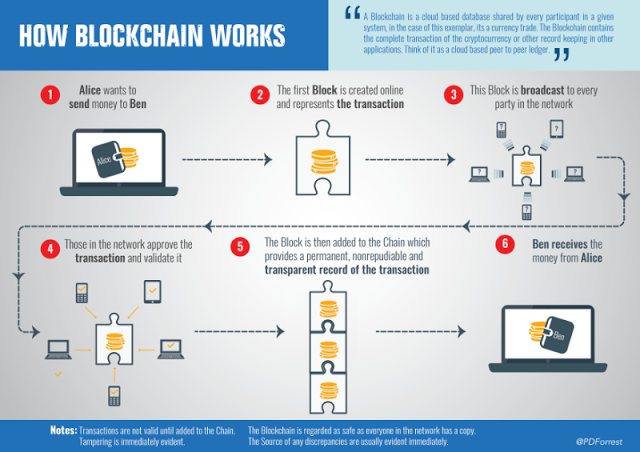
One of the ways that we express the relationship (of what)is like the graph above. Node B represents the user and Node C represents the IoT device. Node B does not trust Node C since IOT wants to record some parts of data and keeps the privacy. By the theory of structural balance, in order to keep the whole network balanced, we need to find another node A which can be another device, another person to be trusted or another group (decentralized).
At present, people think about combining the blockchain technology with the IoT to increase privacy security. The advantage of blockchain is that the block will be broadcasted to many parties to get the validation of information before adding it to the chain. The third parties works in the same way as node A which I want to find out previously. After the information gets validated, it is safe to go released.
IoT still has a few problems currently, but in the near future, these problems are likely to be solved since the public and the market pay much attention on it. Hopefully, IoT can be integrated into people’s life and can be applied in the business system someday.
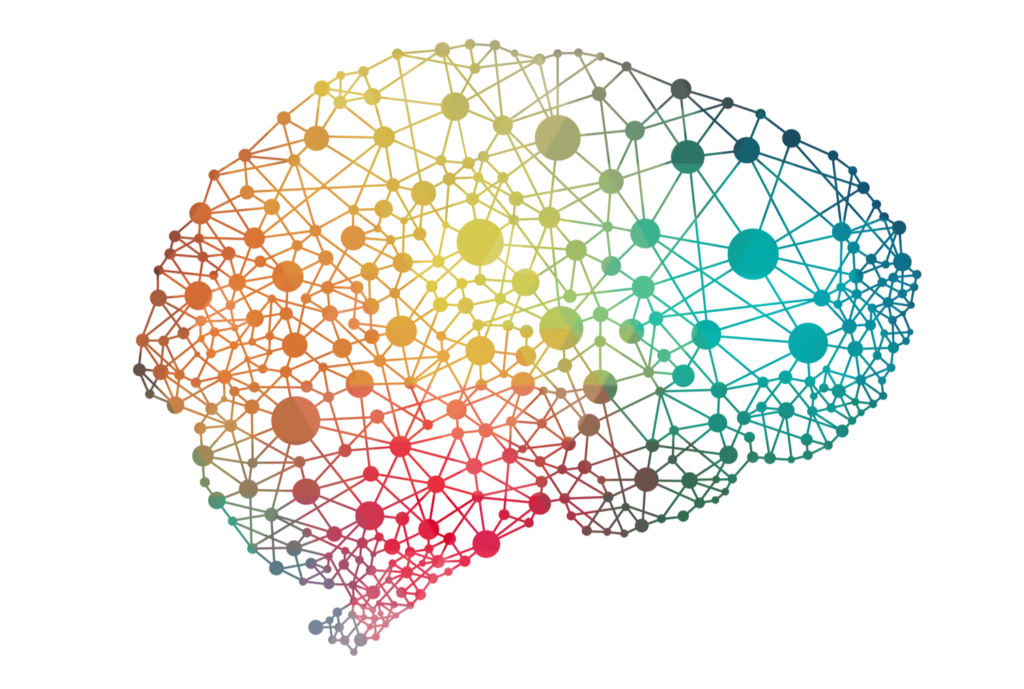
One unique property technology and its concepts have is its applicability to different fields that may not share obvious connections. Consider the brain: arguably one of the most important organs in the body due to its complex structure and its role to control thought, speech, movements, and other involuntary processes such as breathing, circulation, etc., and Neuroscience: the study of the structure and functions of the nervous system. The brain, too, can be analyzed using graph theory and networks to observe brain network data, synaptic links, and various other properties.
This post addresses the correlations between the brain and graph theory. It is fascinating to be able to take concepts learned and find areas such as neuroscience to apply these ideas to. As someone with a desire to use my skills to help others and contribute to the advancement of medicine, this subject greatly reflects the types of activities I can contribute to with my knowledge. Furthermore, choosing this subject helps portray the idea that networks are a useful computational model that makes mapping out complex structures easier to understand.
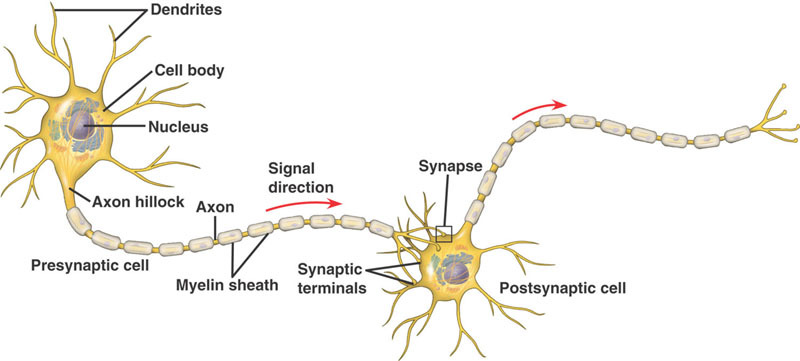
On the surface, the brain looks like a complex structure with many different components. The brain includes millions of neurons that are interconnected through their different axons. But looking deeper, the brain can be looked at as one complex network where the nodes are the brain’s neurons, or entire brain regions depending on the study, and the edges represent the different connections between each neuron. These connections can either be binary or weighted, and directed or undirected depending on the study.
The two common brain mappings using graphs are primarily structural and functional mappings of the brain, and these are used to model different connections. Structural graphs are generally sparse since the most possible structural connections in a given nervous system do not exist. These, in turn, are temporally relative stable. Whereas, functional graphs more dense as they record statistical dependencies among neuronal time series.
The brain could be mapped using a simple graph (ie. nodes & edges are homogenous with each other). However, annotation of nodes/edges can address the simplicity of the model and allow an additional layer of data to be linked to network elements. This type of graph is useful for identifying biologically meaningful networks (ie. strong/weak communities). Additionally, simple graphs can be used to map multidimensional relationships expressed in multilayer networks. These different layers are used to simulate different types of interactions such as synaptic links, temporal correlations, gene expression, etc.
Lastly, a notable observation for mapping brain connectivity arises from the idea that connectivity drives the functional specialization of specific areas of the brain. This means that different areas of the brain have specific connectivity blueprints that indicate their community, resulting in the predicability of their functions. Furthermore, the degree of a neuron, which are the number of connections by a node, or the strength of its connections are a strong indicator of centrality in the brain.
All in all: as complex as a structure like the brain is, using familiar techniques such as graph theory can be used to break it down into specific communities or regions that can be further analyzed. And ironically, the premise of computer science is prevalently evident in these ideas, where you must look at a complex problem, break it down to smaller, easier to manage subproblems in order to complete the full picture.
Humans are social animals that are constantly looking for social acceptance and approval. It has been hardwired into our brains evolution since being in a group dramatically increases the chances that the individual will survive. It’s why we try to constantly track the responses of those around us, and is why people who don’t notice subtle social cues or body language have difficulty communicating. The difference between interactions in a physical and online environment is that, while out brains still function the same way, some of the stimulus required to help moderate our behaviour is blocked, and in some cases, our tribal behaviour is even intensified.
The primary goal of any site on the internet is to maximize user engagement, which is to say, make sure the user stays on their site for as long as possible. This is especially true for social media and networking sites that depend on selling ad space for profit. Given a human’s tribal brain and a platform where people share information and content, social media’s best bet to keep people on their site is to show them what they want to see.
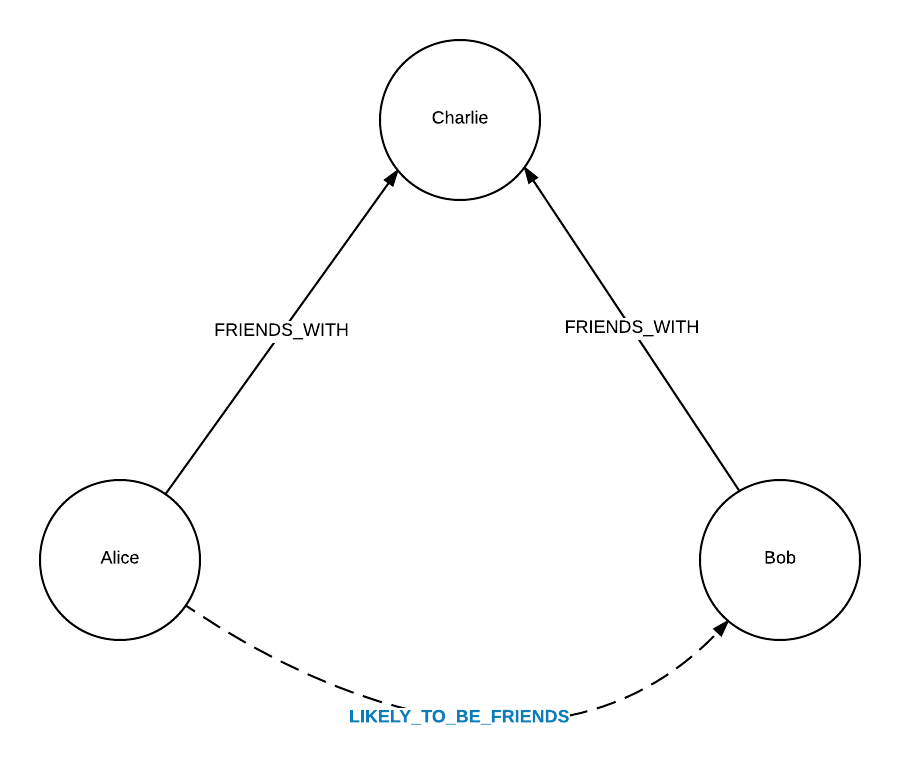
Take for example Facebook. Facebook tries to keep their users online by making them feel comfortable and accepted, and what better way than to connect a user with people that already accept them, their in-person friendships. Given Fb can’t be entirely sure who a user’s every friend is, it extrapolates that information from the people they’re already friends with, exploring mutual acquaintances using the social networking concept of triadic closure. Triadic closure here is the idea that if a user has strong bonds with two other users, two close friends, then it is likely that the two other users may also be friends, or at the very least, know or be interested in knowing each other. For a user on Fb, this means they are generally connected with people who are at least acquainted with the people they already know.
Another aspect of Fb beyond friending someone is the sharing of content. As Fb wants to keep users on their site for as long as possible, it is in their best interests to show a user things they will like and want to see more of. At first, this information may come from the user’s friends as they may, most likely, have common interests. But as the user interacts with the system, liking or disliking, commenting and sharing, Fb gets a better idea of what appeals directly to the user in question and directs similar content their way, so as to keep them engaged.
In the physical world, people moderate themselves due to a fear of rejection from the social structures they are a part of, even if they hold opposing views from others in their community. People who have to live and work with each other are more willing to communicate and discuss their views in hopes of reaching an agreement, due to the social consequences of antagonistic relationships in-person.
On the other hand, the social cost of angering someone or garnering disapproval is comparatively smaller online, where if a user disagrees with another on a certain topic, there may be no obligation on either side to try to convince the other of their perspective. As such, users can easily distance themselves from those they don’t have much in common with, while seeking the acceptance of groups they already identify with. In online communities where the cost of entering and leaving is nothing, it is more work for a user to try to advocate for moderation than to simply leave and find their own echo chamber.
This homophily, the tendency of individuals to associate with similar others, is an inherent part of human biology that social media and social networking sites can use to keep the attention of their users while also quickly delineating individuals into groups they can advertise to. This is beneficial for the platform, but turns any online interaction for the user into an echo chamber that bounces their own views and opinions back to them, which can be intensely harmful as it creates an environment of approval for all behaviours, including ones that are prejudiced or destructive.
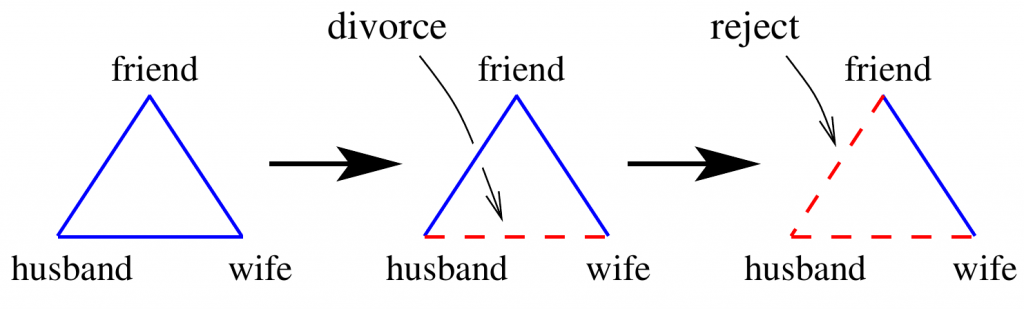
Preventing groups with self-affirming content requires members to have relationships with communities that may have directly opposing views that the original group. This should theoretically be possible, at the very least for people undecided on their opinions, but is not a sustainable state in the long term, as per the Theory of Structural Balance for networks. It suggests that there are certain stable configurations that networks may morph, into over time: specifically, the idea of ‘the enemy of my enemy is my friend’ and ‘the friend of my friend is my friend.’
The latter is what is applied alongside triadic closure to suggest friendships on Fb, while the former forces the idea that, if there is friction or enmity between the two groups, anyone caught in between would at some point have to make a choice. Which is to say, if a user if friends with two people or groups that hate each other, at some point it is likely they will pick a side. This denotes the isolationism of these networks as their most stable form within the current system.
In an effort to keep users on their platform, social media strives to create accepting communities. But as a result of human tribal mentality, social network interactions and the platforms’ own goals, this acceptance comes at the cost of isolation in a cycle of approval without mediation from outside voices.
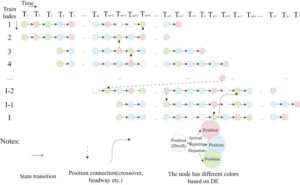
Rail network is a crucial network which has to be made efficient. The increasing density of population needs to be considered as a key factor in the entire railways network. The train timetable scheduling can have defects because of large number of trains and passengers which cause real time traffic delays. Such delays can be prevented with a better evaluation and identification of the rail system performance. This can be done by considering a Train State Graph (TSG).
A train state graph is a directed graph with horizontal axis as time stamp and vertical axis as train index. The time stamp shows an occurrence of an event such as arrival, departure, delay, braking. Each nodes represents a unique state of a train. The vertices in the graph shows the transition of train. As suggested in the paper, we can set a constant time step (e.g. 50 s), so that the longest time interval between two discrete events is the constant time step. This would help to analyze events but will not be effective if the time constant is too small or too big. A solution to this problem is to mark the delays caused by major events and then remove them and decrease the delay for future. In other words, simply identify and try to eliminate the root causes of the delay.
Throughout the last few decades, the United States has been working to stop the illegal cocaine trade. Most of the cocaine is produced in Colombia where traffickers send them through various routes in Central America and into the United States. The United States use interdiction to seize cocaine shipments at several checkpoints in Central America and to make arrests. However, the NarcoLogic model is proposed to showcase that interdiction may not be working as intended and instead, it may end up opening up new routes in Central America that are more well hidden. Currently, the United States is spending as much as $18 billion from its drug control budget towards interdiction. However, over the last 20 years or so, cocaine prices have dropped and deaths by cocaine overdoses have increased. This leads to people thinking that interdiction may not be effective.
As you can see from the graph, the red nodes indicate active checkpoints while the gray nodes indicate inactive checkpoints that may have been interdicted. Dashed edges indicate trafficking routes between checkpoints. Important red nodes are the one at the bottom right in Colombia which is the main source of cocaine as well as the ones near the Mexican border which is the main destination. There are a lot of inactive nodes in Costa Rica and Panama where there used to be a lot of checkpoints. But interdiction has rendered them inactive so in turn, Colombia gets a higher degree in the network by connecting edges all the way to Honduras and Nicaragua. This decreases the overall diameter of the network as well as average path length which means less checkpoints and harder for law enforcement to track cocaine shipments. Most edges in the graph are local bridges with relatively low betweenness which showcase the many paths that cocaine can get trafficked across Central America. So even if one local government decides to take a stand against cocaine trafficking, people can easily use other routes which shows how ineffective interdiction can be. There is barely any triadic closure which makes sense when you’re mapping routes because routes are all about taking shortcuts. This proves that cocaine trafficking can manage to be very efficient without needing extra routes since law enforcement in these countries often do not have to resources to stop it.
In conclusion, interdiction has not been very effective at stopping cocaine trafficking since it has instead formed shorter routes and those that are more spread out into either remote regions of areas of high poverty.
We know that graphs exist everywhere in the world and on any scale. Unsurprising, even minerals have networks and graphs at a cellular level. We are going to explore graphs of a particular mineral, zeolite, and how an MIT team managed to apply graph theory to predict the transformation of zeolite types.
Zeolites are microporous, aluminosilicate minerals. It is a very powerful mineral, and it is most commonly used as adsorbents, which hold molecules of a gas or liquid, and catalysts, which increases the rate of a chemical reaction. Examples include speeding up the “cracking” of petroleum in refineries, as well as freshening up your cat’s litter box.
Zeolites eventually turn into quartz. However, before that happens, this mineral is always in a metastable state. It can transform into other metastable states, some of which are already known. They can be produced with organic chemical compounds as well, but because organic material is expensive, it would be more economical to produce it through transformations.
What the researchers wanted to find was pairs of zeolites that are readily able to transform into one another. They used AI to read 70,000 research papers on zeolites. The results from this research and analysis were that a topological description based on graph theory identifies the relevant zeolite pairings. The graph-based descriptions were based on locations and numbers of chemical bonds. These descriptions not only confirmed existing pairs but also helped discover unknown pairs, and it is proven to predict forms of zeolites that can intergrow.
The findings can also help explain theoretical transformations that do not seem to exist.
It is amazing that graph theory could find itself in the obscurest of places. These findings could lead to the production of a whole new set of zeolites, expanding its ever-growing practical usage.
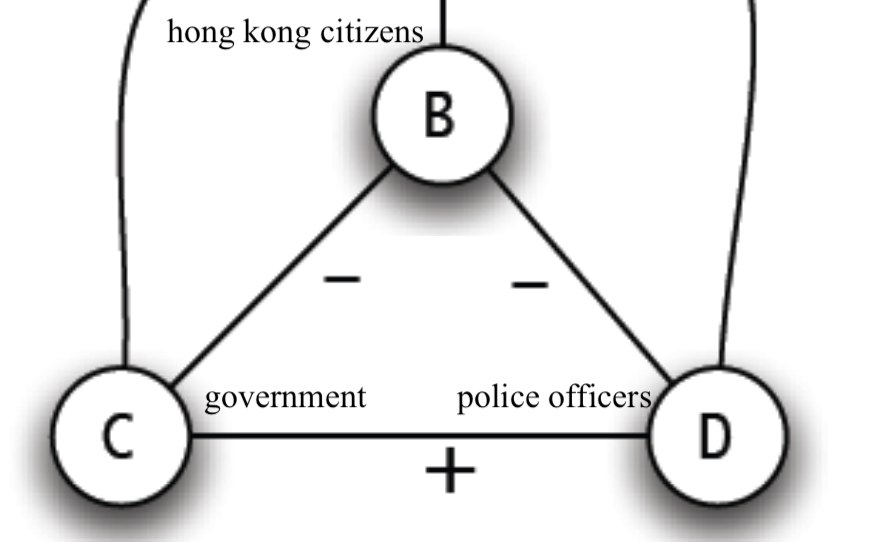
Hong Kong has been on global headlines since June, with 2 million (that’s a quarter of the population) marching on the streets demanding the withdrawal of the extradition bill, which has since evolved into anti-government protests . With just over 7 million people in the semi-autonomous city, some people wonder – why hasn’t the entire population turned against the government yet? Everybody has seen the police brutality and the ignorance of the government – yet, everyday on social media, there are people who choose to ignore the police-state like and authoritarian actions by the government and instead focus their attention on protesters fighting for Hong Kong’s freedoms?
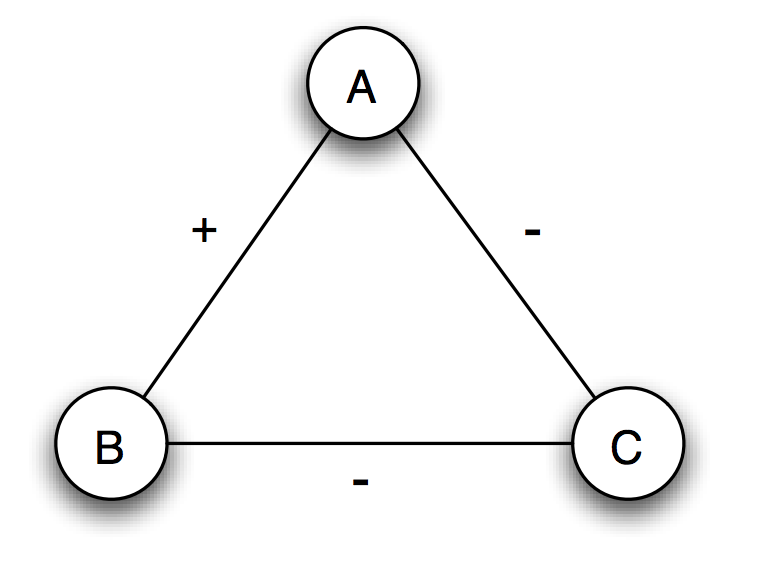
It can simply be explained with the Theory of Structural Balance. It became clear through the intuition [Heider ‘46] that the “enemy of my friend, is my enemy”. Consider the following scenarios:
Protesters are blocking my way to work. I dislike them. The protesters dislike the government. Thus I support the government’s actions. (Example of exactly one edge labeled +)
Structural balance is achieved.
The police force has stepped on my freedom (negative edge). The government controls the police force. (positive edge), thus I dislike the government.
These two intuitive examples show exactly that the Balance Theorem [Cartwright-Harary] can be applied to the situation in Hong Kong. Take note of the underlined sections of the scenarios – we can use local view to fill in this edge (without previously knowing) to achieve balance. Overall, the network is clearly separated into two notable factions – people who are in support of democracy, and people who are supporters of the Beijing controlled government.


