
One unique property technology and its concepts have is its applicability to different fields that may not share obvious connections. Consider the brain: arguably one of the most important organs in the body due to its complex structure and its role to control thought, speech, movements, and other involuntary processes such as breathing, circulation, etc., and Neuroscience: the study of the structure and functions of the nervous system. The brain, too, can be analyzed using graph theory and networks to observe brain network data, synaptic links, and various other properties.
This post addresses the correlations between the brain and graph theory. It is fascinating to be able to take concepts learned and find areas such as neuroscience to apply these ideas to. As someone with a desire to use my skills to help others and contribute to the advancement of medicine, this subject greatly reflects the types of activities I can contribute to with my knowledge. Furthermore, choosing this subject helps portray the idea that networks are a useful computational model that makes mapping out complex structures easier to understand.
The Brain and Graph Theory
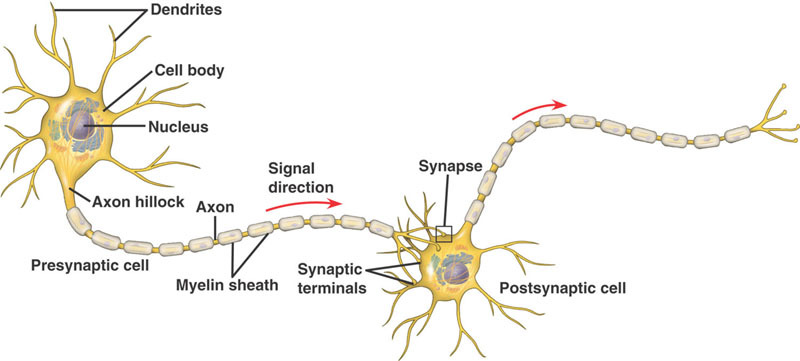
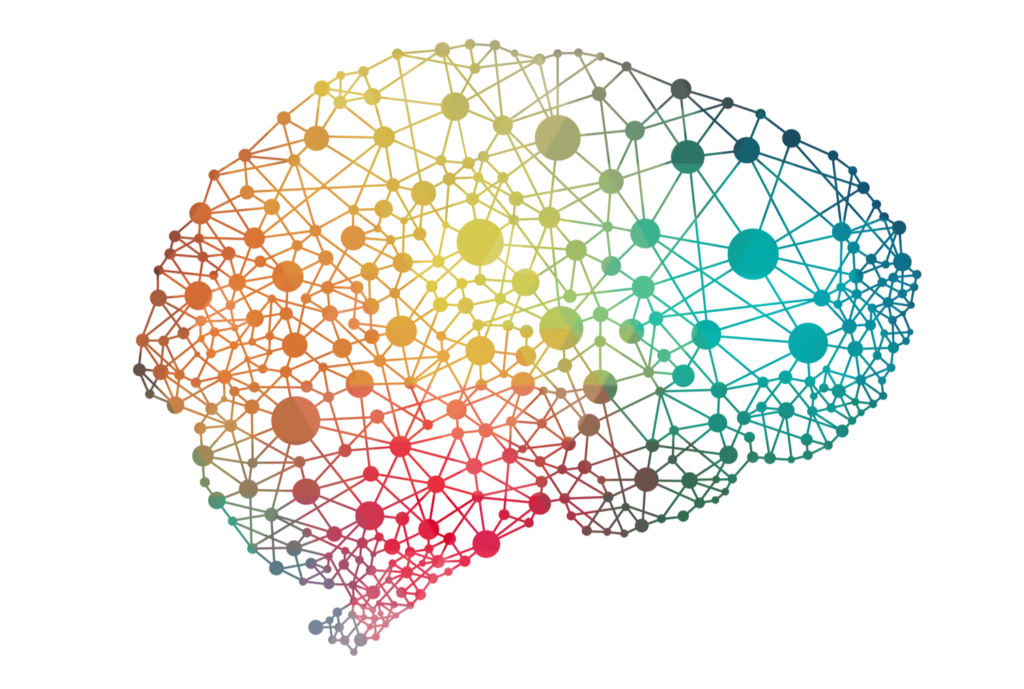
On the surface, the brain looks like a complex structure with many different components. The brain includes millions of neurons that are interconnected through their different axons. But looking deeper, the brain can be looked at as one complex network where the nodes are the brain’s neurons, or entire brain regions depending on the study, and the edges represent the different connections between each neuron. These connections can either be binary or weighted, and directed or undirected depending on the study.
The two common brain mappings using graphs are primarily structural and functional mappings of the brain, and these are used to model different connections. Structural graphs are generally sparse since the most possible structural connections in a given nervous system do not exist. These, in turn, are temporally relative stable. Whereas, functional graphs more dense as they record statistical dependencies among neuronal time series.
The brain could be mapped using a simple graph (ie. nodes & edges are homogenous with each other). However, annotation of nodes/edges can address the simplicity of the model and allow an additional layer of data to be linked to network elements. This type of graph is useful for identifying biologically meaningful networks (ie. strong/weak communities). Additionally, simple graphs can be used to map multidimensional relationships expressed in multilayer networks. These different layers are used to simulate different types of interactions such as synaptic links, temporal correlations, gene expression, etc.
Lastly, a notable observation for mapping brain connectivity arises from the idea that connectivity drives the functional specialization of specific areas of the brain. This means that different areas of the brain have specific connectivity blueprints that indicate their community, resulting in the predicability of their functions. Furthermore, the degree of a neuron, which are the number of connections by a node, or the strength of its connections are a strong indicator of centrality in the brain.
All in all: as complex as a structure like the brain is, using familiar techniques such as graph theory can be used to break it down into specific communities or regions that can be further analyzed. And ironically, the premise of computer science is prevalently evident in these ideas, where you must look at a complex problem, break it down to smaller, easier to manage subproblems in order to complete the full picture.
Sources: https://www.ncbi.nlm.nih.gov/pmc/articles/PMC6136126/