Schizophrenic Brain Function Network Analysis

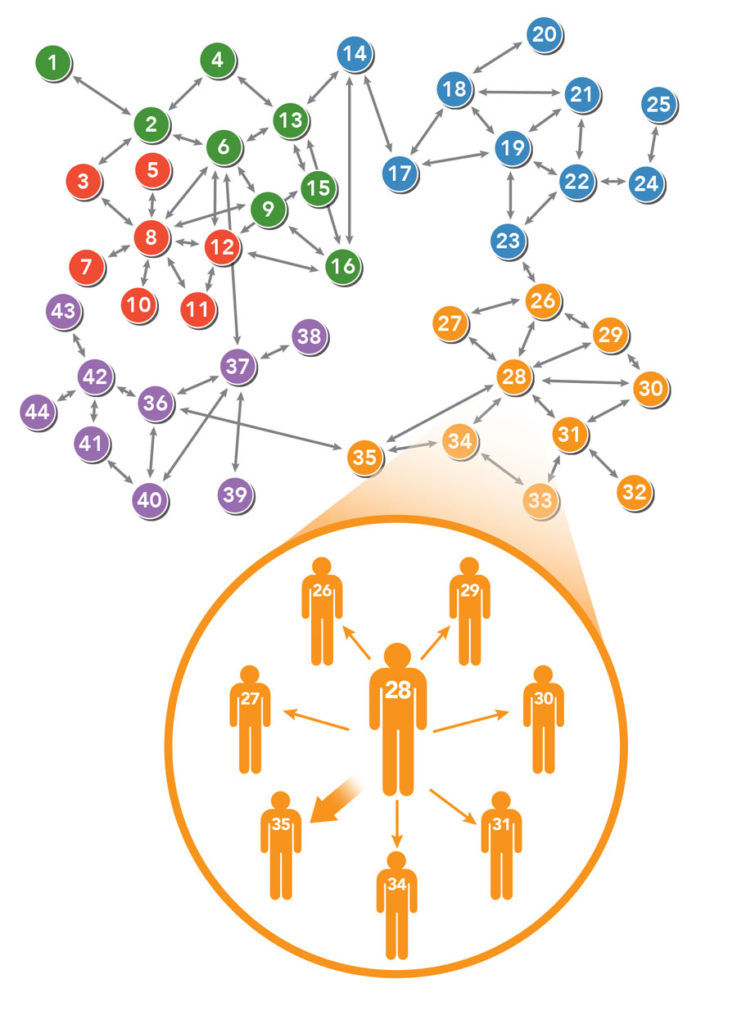
In class we learned about small worlds, clustering co-efficients, and path length. Throughout our class discussions we often used social media, and social networks as examples. But graph theory is a far-reaching field and the topics we covered in class can also be used in various other networks; including the brain function network.

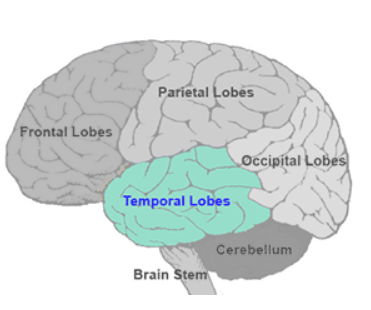
In an article published in May 2019 titled “Brain Network Analysis of Schizophrenia Based on the Functional Connectivity” researchers outline how graph theory can be used to identify the effects of schizophrenia on the brain function network. In their study, the researchers analysed the Magnetoencephalography (MEG) of 9 patients with ‘normal’ brain activity and 9 patients who had been diagnosed with schizophrenia. MEG is a neuroimaging technique for mapping brain activity by recording the magnetic fields created by the electrical impulses within the brain [2]. In the introduction the authors note that, “High efficiency analysis of small world network topology has become the main way to analyze brain function network.” This is due to the high connectivity and efficiency of the human brain function network. The goal of the study was to compare the small world properties of the schizophrenic brain function network against that of the ‘normal’ brain network. This was achieved by first mapping the brain function connectivity network in a resting state with MEG. Since the brain function connectivity network can fluctuate over time, even in the resting state, the study used a sliding window technique to capture the left temporal and frontal MEG signals of the 18 patients in a resting state with their eyes closed.

[3]

The researchers then processed these signals in order to produce binary and weighted networks. From these networks they calculated the average shortest path length and the average clustering coefficient. The study found that the ‘normal’ human brain shows increased small world properties when compared to the schizophrenic brain. The healthy patients brain function networks had comparatively smaller shortest path lengths and higher clustering co-efficients. Graph theory analysis of the brain function network can produce significant results for better understanding schizophrenia, an often crippling disease. This study shows that patients with schizophrenia have decreased small world properties in their brain function networks, which may result in a slower information exchange rate and lower efficiency.

The study outlined above highlights how graph theory can be used not only to help us understand the overall structure of the social world, but also naturally occurring biological structures. The human brain is an extremely complicated organ that we do not fully understand. However, through the use of graph theory we can better understand the healthy structures and patterns that exist within our brains and how variations within those structures (such as decreased connectivity) can impact our health. Schizophrenia, among many other mental illnesses, is both poorly understood and potentially incapacitating. Knowing that graph theory can be used to provide better diagnosis and to possibly move us closer to providing assistance to those impacted by the disease highlights how deep of an impact graph theory can have, not just in understanding the world around us, but also in using that understanding to significantly help those in need.

RESOURCES:

[1] X. Zhang, L. Wang, Y. Ding, L. Huang and X. Cheng, “Brain Network Analysis of Schizophrenia Based on the Functional Connectivity,” in Chinese Journal of Electronics, vol. 28, no. 3, pp. 535-541, 5 2019.
doi: 10.1049/cje.2019.03.017
URL: http://ieeexplore.ieee.org.myaccess.library.utoronto.ca/stamp/stamp.jsp?tp=&arnumber=8812649&isnumber=8812608.

[2] Magnetoencephalography . In Wikipedia. Retrieved October 12, 2019, from https://en.wikipedia.org/wiki/Magnetoencephalography

[3] Brain Map: Temporal Lobes. In Queensland Health. Retrieved October 12, 2019, from https://www.health.qld.gov.au/abios/asp/btemporal_lobes

Great Memes are Just Diseases

In today’s media-driven and ever-connected digital landscape, it is hard to understate both the prevalence and significance of memes in our modern society. From mindlessly filling up your instagram feed, to serving as fuel for the protesters in Hong Kong, memes are now a common and effective way of communicating ideas en masse.

As such, it could be insightful to understand just what separates a great, or viral, meme from all the others. In a 2013 paper by Weng et al., they found that they were able to predict the virality of a meme based on whether it spread like a simple or complex contagion. Complex contagions often start with a very small probability of adoption, but can increase this probability with multiple exposures. This behaviour lends itself to a ‘trapping’ effect within communities, where it spreads quickly within the community but becomes difficult to leave it, based on the principles of Structural Trapping, Social Reinforcement, and Homophily (as discussed in class).

Memes that spread like simple contagions however, are much more akin to diseases. In this situation, each individual exposure carries the same probability of adoption, but that base probability is often significantly higher than those of complex contagions. As a result, these memes don’t falter and stew in 1 or 2 communities, but quickly infect the whole network.

Based on this understanding of meme virality as a symptom of its contagion type, Weng et al. were able to build a ML model that could predict which memes would take off based on its initial spread amongst communities. In the following diagram, we can see that the non-viral meme (a complex contagion) was heavily-concentrated in one community, but was unable to find a decent footing in any others. In contrast, the viral meme (a simple contagion) did not have as heavy a concentration in any single community, but did manage to gain a decent spread amongst several communities. We can then see the results of these spreads as the viral meme was able to infect a plethora of new communities on a regular basis (notice the prominent circles with a redder hue). Meanwhile, the non-viral meme was relegated to it initial community (dark blue circle) and did not have anywhere near as much of an impact on the few other communities it did get into.

In conclusion, we can clearly see that, as a by-product of the way social communities (which are just social networks) interact, it is more optimal for a meme to loosely relate to a wide variety of people than to strongly relate to any one group. Indeed, this revelation may seem quite intuitive, but it is nice to have this intuition grounded in data and empirical analysis. After all, if we still can’t beat the common cold, how could we ever hope to beat Pepe the Frog?


References

Lilian Weng, Filippo Menczer, and Yong-Yeol Ahn. Virality Prediction and Community Structure in Social Networks. Nature Scientific Report. (3)2522, 2013.
Companion Webpage found at: https://lilianweng.github.io/virality.html

Git & Graph Theory

Version control systems are a staple of modern software development. With popular applications like Git and SVN, almost all production-level software written today is managed with version control systems. However, what is not as well-known is that at the heart of these systems is a beautiful and practical application of graph theory.

The commit history of any version control repository can be represented as a directed acyclic graph, where each node is a revision of some source code, and the edges are links in time pointing to the previous commit made. The main branch of this repository, often named master, is essentially a straight chain of commit nodes, with each edge linking commits to its previous commit dependency.

The tree-like structure of this particular repository comes from the ability to “branch” off certain nodes in the master branch, which allows parallel lines of development. The interesting part is when we consider the actions of “merging” and “rebasing”, which turns the graph from a tree to a directed acyclic graph. 

A typical graph of a repository’s commit history.

Merging is the act of taking two branches and combining them together, constructing a new node in the commit history containing the combination of changes made on both branches.  Note this still forms a directed acyclic graph, since every edge is only ever directed backwards in time- there is no way to form a cycle in this case.

Merging seen in action.

Rebasing, on the other hand, constructs a new edge, rather than a new node. When branch A is rebased onto branch B, the head of branch A modifies its edge to point to the tail of B, essentially replaying changes made to the source code in a new order.  Note this also still forms a directed acyclic graph!

Rebasing seen in action.

While Git is infamous for its terse and confusing commands, the model behind it is quite interesting!

https://medium.com/girl-writes-code/git-is-a-directed-acyclic-graph-and-what-the-heck-does-that-mean-b6c8dec65059

BGP Protocols among Autonomous Routing System and Route Hijacking

Broad Gateway Protocol

Suppose you want to send a file over to your friend, it has to undergo many layers of the internet. In the transport layer, files are first fragmented into small packets, which are the small data units that gets transferred over the network. Network routers play an important role across the internet, because they are the traffic control devices that ensures packets are safely and efficiently delivered to the destination specified by IP headers. Border Gateway Protocol(BGP), is a protocol between routers that updates traffic information about the network, the most important thing it does is that it finds the shortest path for the destination IP address.

The whole Routing System is a decentralized network

  • Each rounter and IP address represent a node and its location respectively.
  • Packets are the messages get transferred from Node s to Node t.
  • Source routers only know other routers’ IP address in its IP address cache.

For a file transfer from source router <s> to destination router < t>, the source router is given a file and the destination IP address to send to. Initially, the source router only knows the routers that are cached in its IP address table, it then messages to all the IP address on, which in turn should have messaged to all the IP address they know, essentially it conducts a breadth first search. Source router then transfers the file over to the router that claims to have the shortest path.

  • Route Hijacking

24th of April,2018, Los Angeles, Seattle and Detroit in the US were able to connect to Amazon’s DNS server. These regions connected to a network prefix 205.251.193.0/24 (Amazon’s announced proper prefix is 205.251.193.0/23)shows up mysteriously. This is a route hijack, a malicious intent took control of a network and advertise a fake shortest route to Amazon. During the hijack, This allows the hacker to redirect traffic to other places than where it was supposed be directed to, namely Amazon.

Even the network routing system is designed efficiently for network traffic. The system is intended for a trustworthy environment where every routers play according to the rule. However, It is very vulnerable to malicious attacks.

Resources:

https://blogs.akamai.com/2018/11/bgp-route-hijacking.html

https://blog.thousandeyes.com/amazon-route-53-dns-and-bgp-hijack/

Google Stadia: Bridging segregated clusters of the video game community?

Video games has seen an exponential rise in popularity and investment over the last few decades. What began as an experiment to bring interaction to a computer screen has lead to a billion dollar industry worldwide. In response, many companies have popped up or joined the industry to make games for gamers to enjoy, with the effect of creating communities centered around specific game console platforms. The term “console wars” is rooted since around the start of the millenium, and refers to the fact that in recent years, the gaming industry is segregated into communities of players who stick to a particular console. However Google is aiming to break that apart. Google Stadia is an effort redefine these communities as rather than dense clusters bridged together by players that operate on more than one console or specific games offering crossplay, to a routing of players to a more small-world community.

Google Stadia is a service, that takes a gaming console, hardware medium to play video games on, and puts it on the cloud. One can simply use a Chrome browser or the Chromecast service that Google offers. According to Phil Harrison, Vice-CEO of the company, stated that gamers could expect to play games regardless of console platform as well have the ability to have crossplay. Crossplay refers to a player playing with other people for a particular game, where they may not necessarily be both using the same console.

An idea essentially is formed about how the networks are formed. The major three companies, Microsoft, Sony and Nintendo have a big community of gamers that play games from them, forming big clusters. Unless a game offered crossplay or if a player owned more than one console, these communities were highly centered to whatever platform of choice. There is a rivalry going on between all three, forming a negatively balanced relation for a majority of the video gaming history.

Google Stadia aims to bridge that gap. Similarly to how in the building of small-world models, especially Kleinberg’s model, discussed in class, Stadia aims to provide a convenient path for players to connect via a new platform that doesn’t require one to choose a side and no matter how rooted into the current communities they are. This however is still all hypothetical. It remains to be seen if one service can finally bridge the dissenting split of players.

Information spread through social media

Nowadays, the internet is helping information to flow more extended and actively. Let’s take journalism as an example. Back to 20 years ago, if there was breaking news, people usually could not get announced until it is reported on tv or newspaper. However, by using mobile phones now, people can receive messages at any time anywhere.
According to Thomas and Varghese, they give an example of how the tweet is expressed through these people(figure 1). This reminds me of the 6-degrees we discussed in class. Tweets are only spread in one-way, and also, people can retweet even they are not friends. Therefore, the information can be spread wider and wider. The report suggests that the number of people who can see the information is growing exponentially. Especially, if one of the reposters is a high-profile people, then the tweet will spread way faster than usual. This is the effects of target’s characteristics.


Several factors will enhance the spread of information on social media. First off, the power of social norms; secondly, “having a clear moral incentive to act”; thirdly, the feeling of compassionate; fourthly, turning the social pressures into personal behaviour. These make people feel a sense of belonging, and more likely to engage in the event. People think they are having the same behaviour as others in society. However, this is causing problems. Users are more likely to get participate rather than doing the right thing. According to (2015). Weibo and Wechat are becoming the main method of Chinese receiving information. The report suggests that about sixty percent of the fake news comes from Weibo. Because of the lack of self-correcting ability, most people cannot judge the validity of the information. Then rumours become widely-known and hard to refute. So, fast-spreading from social media can also cause big problems.


We can see that social media is changing people’s daily lives. It allows people to have faster access to information. However, at the same time, the sources could be invalid. People now should have the ability to judge the correctness of information rather than just “follow and retweet”.

Xiao, E. (2019). 60 percent of fake news come from Weibo. [online] BBC News. Available at: https://www.bbc.com/zhongwen/simp/china/2015/06/150624_china_new_media_report [Accessed 11 Oct. 2019].

Varghese T. K., Jr (2017). How Does Information Spread on Social Media Lead to Effective Change?. Clinics in colon and rectal surgery, 30(4), 240–243. doi:10.1055/s-0037-1604251

Instagram Influencers and Homophily

Nowadays, a lot of consumers use Instagram as a source of style inspiration. This has been a wonderful thing for brand marketers — instead of worrying about the logistics of creating a marketing campaign, hiring models, creating sets, and preparing shoots — all of that work can be delegated to social media influencers. Now comes the question — as a brand, how should we choose the right influencer for our marketing campaign? How do we ensure that we get the engagement that we want? Should we choose macro-influencers — those with a large following, or perhaps those that are lesser-known? What is the most important factor that determines how effective an influencer is when engaging an audience? Homophily.


One study aimed to find out the reasons for which different followers liked certain influencers. Do people follow influencers because they are attractive? Well, only somewhat. Attractive posts catch the eye. However, it was not the main reason. When asked about why they followed their favourite influencer, many participants said that the influencer led a lifestyle that they wanted for themselves, or they shared similar interests with them. The influencer has to be relatable. In this way, Instagram acts as a mirror for followers. Influencers are often living the life that their followers want. One of the participants, Martha, said that both of her parents were doctors and wanted her to pursue medical school instead of fashion-related subjects. One of Martha’s favourite influencers is Eva Chen. She similarly left medical school to work for a fashion magazine. Perhaps Martha felt that Eva would understand her circumstances, and is now someone she aspires to be. Birds of a feather indeed flock together. On Instagram, the influencer model follows the concept of homophily. Followers prefer to like influencers that they share common interests with. Not only will he/she be able to see more content that they like — but through the influencer, he/she is exposed to that influencer’s follower-base.


If you thought that choosing the macro-influencer (with more followers) over the micro-influencer would yield more engagement, think again! One study also found there was trust for micro-influencers as compared to macro-influencers. Homophily explains this as well. When an influencer has a large following, they usually have to cater to a larger range of interests held by their followers. They may be viewed more like a celebrity to be admired from afar —  which decreases the influencer’s similarity. On the other hand, a micro-influencer might have a following that shares similar interests with each other. Pleasing “everybody” is not an issue. 


The main takeaway is that homophily (not necessarily popularity!) is what drives engagement and credibility on Instagram. One may think that someone would be more likely to show affinity with a more popular influencer. But instead, it is homophily —  how similar a follower perceives the influencer is to them.

Links

https://essay.utwente.nl/72306/

http://hb.diva-portal.org/smash/record.jsf?pid=diva2%3A1232481&dswid=3681

Breaking the internet with 11 lines of code

Nowadays, web apps are extremely complex and are often comparable to native applications. Yet in the Javascript ecosystem, these apps are dependent on various modules that serve as a small cog in the wheel of the app and these modules live on the repository known as npm. Over time, developers become dependent on these modules (sometimes regardless of simplicity) to address issues or features in the application, which results in an application’s codebase with a dependency graph similar to the following:

Large, entreprise applications may have hundreds if not thousands of dependencies and it only takes one to break to bring the application down. In fact, a similar scenario happened recently with the infamous left-pad module, bringing down Node and Babel.

npm creates a single point of failure that makes it extremely susceptible to attacks/failures
The npm repository of JavaScript modules creates a single point of failure for most, if not all JavaScript-based applications in the world. Why is this so? Whenever a module (let’s call this A) is used as a dependency for a web app X, this creates a directed edge from A to X. However, modules can also use other modules as dependency, so another module B may also have A as a dependency, creating another directed edge from A to B. Therefore, a web app Y may not directly depend on module A, but if it utilizes module B and module A is removed or changed maliciously, Y will encounter failures (at the build step or even during runtime) or be susceptible to the malicious attack. To determine these modules, we consider them as nodes in a graph and find the nodes that act as bridges, which can be done by looking for nodes with the highest betweenness.

Developers should make it a goal to minimize the applications dependencies to retain greater control of application stability and security
Over time, a popular library that includes various modules may become extremely fragile since only one of its modules failing would break the entire library. This is why developers should minimize the use of modules, especially for simple functions. For example, writing a small wrapper for native ES6 Fetch API should be preferred over Axios (~6 dependencies) because it is a simple function that should not require many dependencies.

In extreme cases, dependencies can be updated and injected with malicious code without developers from knowing, then every application that uses the module is affected, which causes another cascading effect. One example of this is the event-stream module that started to steal cryptocurrencies’ private keys to wallets. One way to prevent this from happening is to verify packages using some sort of hash to guarantee a package’s validity. Otherwise, we have to hope that bad code doesn’t leak into these modules.

Thank god for git right?

Inspired by: https://medium.com/graph-commons/analyzing-the-npm-dependency-network-e2cf318c1d0d

The Majority Illusion

Here are two questions to ask yourself:

  1. How is it possible that something seemingly unpopular blows up all of a sudden and becomes a trend overnight?
  2. What if it actually hasn’t become a trend, and you’re the only one who perceived it to be that way?

This phenomenon is known as the “majority illusion”—a paradox where you conceive a certain attribute as being popular just because most of the people around you have adopted it when, globally, that certain attribute is actually uncommon.

As an example, we have the figure below.

The graphs (a) and (b) form the same small world network, as discussed in class, of 14 nodes and 3 coloured ones, with the only difference between them being which nodes are coloured. In graph (a), the uncoloured nodes see that at least half of their neighbours are coloured. This, however, is not true for any of the nodes in graph (b). If we now define nodes as individuals and a coloured node as a person with a shared attribute, we can see that the “majority illusion” would only apply to the uncoloured nodes on graph (a) and not graph (b).

What makes the “majority illusion” fascinating is that only 20% of the individuals in graph (a) have a shared attribute, yet the remaining 80% would still believe the attribute is popular just because at least half of those who they are connected with have it.

The “majority illusion” does not occur in just any regular social network though. The most important aspect, as Lerman’s article states, is that the network is disassortative. In other words, the “majority illusion” is stronger in graphs where nodes of low degree are more likely to connect with nodes of high degree, and these nodes with high degree have a shared attribute, as observed in graph (a).

Perhaps it is obvious that individuals who have high degrees of edges are more influential, or that those who have low degrees of edges are more easily influenced since their circle is smaller. This, however, can be difficult to realise when you yourself are part of the network. Just like the decentralized search seen in class, we only know of the individuals adjacent to us, and do not have complete knowledge of the network.

Something we can learn from the “majority illusion” paradox is that the next time we see something becoming popular, maybe we should take a step back to check if that really is the case before we get influenced or begin to accept it as the norm. It might even be to all of our benefit to connect with more people in order to gain a wider perspective of our world—which, in fact, even supports Lerman’s article in that the “majority illusion” is weaker in graphs that are assortative.


References:

How to create a healthier community by controlling the diffusion of information in social networks

Diffusion of innovation is the phenomenon where a new idea/innovation is introduced into the observed social network, and initially, a few people adopt this idea, and then either the idea dies down, or more and more people adopt it over time. Different people adopt to new innovations at different rates, and many papers including Rong and Mei’s “Diffusion of Innovations Revisited: From Social Network to Innovation Network” classify these people into 5 categories: innovators, early adopters, early majority, late majority, and laggards (7).

The diffusion of information through a social network is a very important field of study because it affects everyone. Being able to model a network of social relations and roles within a community, identifying leaders of clusters within that network and discovering thresholds that impede the diffusion of information gives us the power to create drastic changes in a community. Most articles I came across when researching this topic studied methods to improve the diffusion of information. In many cases this is desirable: when companies introduce innovative products into the community, they try to market them in a way that as many people as possible adopt their new products. They use the tactics of identifying social leaders and influencers who can help more people gain awareness and trust in this innovation, also they identify competitors in the market and try to outperform them, and they collaborate with other companies to gain greater influential power over the community. However, in some cases diffusion of information is undesirable, so we also need to study ways to control how information spreads through a network, including intervention of the diffusion.

When I found the article by ResearchFeatures which discusses Professor Thomas Valente’s studies of how social networks affect an individual’s health-related behaviors, I realized that since unhealthy habits and misinformation often result from the influence of an individual’s environment, they can be changed on a large scale by using our knowledge of how to control diffusion of information in a social network.

First, let’s analyze how the behaviors (both positive and negative) spread through a social network. Valente describes the network structure of a community as several dense clusters with limited connections between the clusters (see image below). This correlates accurately with the social network architecture presented in class. Examining these clusters more closely, we will be able to see that each cluster has a group leader, who has a much higher “out” degree of edges leading to the people they influence. If these leaders are the innovators, then the ideas will diffuse very quickly across the community. Considering the 5 categories mentioned earlier which represent people with varying aptitudes for adapting to new ideas, this article introduces node weights representing individual thresholds to the diffusion of information. So, the quicker an individual can adapt to a new idea, the faster the idea can spread to their connections and so on.

To battle the spread of behaviors that negatively affect individuals’ health, Valente proposed four intervention strategies: identification of influential change agents, group segmentation, induction, and network alteration. The first strategy – individual interventions – involves targeting opinion leaders to influence their behavior, and then depend on these individuals to propagate these good habits on their followers (or, conversely, to intervene with their negative influence to stop its propagation). The second strategy involves creating segmentation interventions – helping small clusters of individuals overcome a negative habit or to embrace positive ideas. This is also effective because the probability and speed of the average person adapting an idea in a community are directly proportional to the percentage of their surrounding connections who have already embraced the idea. Induction intervention is a strategy to raise exposure to positive behaviors by cascading them via word-of-mouth, commonly known as “going viral”. Finally, alternation interventions differentiate from the previous 3 strategies which take advantage of existing network strategies. In this strategy, the network is altered in order to facilitate optimal behavioral adoption by influencing social connections of individuals.

These strategies have been employed with varying degrees of efficiency even before the study of network analysis gave us more knowledge to do so more efficiently. With modern tools such as computer network simulations and the plethora of available research, we are able to influence more people at greater speeds than ever before. We need to use this power to create healthier, more educated communities.

References:

[1] ResearchFeatures. “Diffusion of innovations within social networks“, May 31, 2018 . Study done by Professor Thomas Valente from the University of Southern California.
( https://researchfeatures.com/2018/05/31/diffusion-innovations-within-social-networks/ )

[2] Rong, Xin; Mei, Qiaozhu. “Diffusion of Innovations Revisited: From Social Network to Innovation Network” [499-508]. ACM, November 1, 2013. Taken from:
( http://www-personal.umich.edu/~qmei/pub/cikm2013-rong.pdf )