Network representations for the analysis of chemical pathways

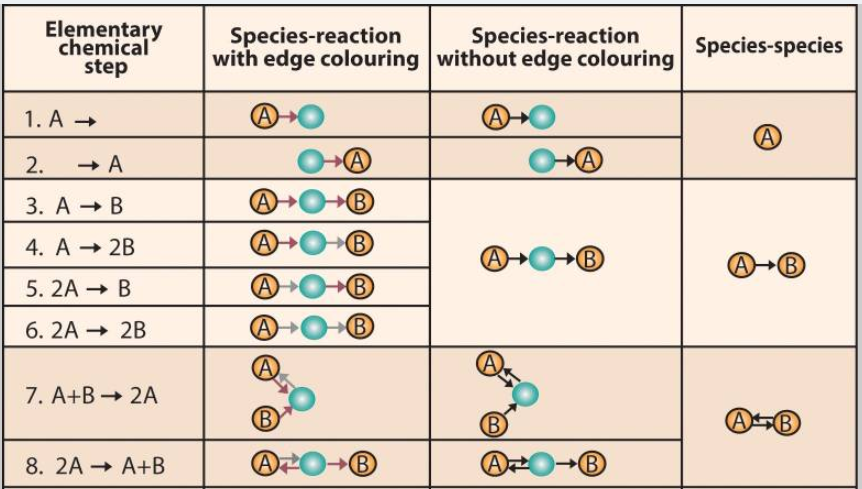
Systems chemists increasingly use network representation to investigate chemical pathways and their group. With the advent of high-performance scientific computing, graph databases (like Neo4j) gradually gain its popularity in representing chemical interaction. I will introduce how the network model and graph database boost the process to find a candidate for a particular experiment. As demonstrated in the graph below, a complex reaction mechanism can be represented by a set of elementary chemical reactions that are easily translated into a directed graph model. In this case, one node represents either one reactant or product. For one reactant, it can point to its product with edges containing the information of the chemical reaction (like the rate of reaction, the speed of reaction, reaction condition, etc). If we can get a path from the reactant node to the required product node, then there is a series of chemical interactions that can transform the reactant into the product. Suppose a chemist wants to find the fastest way to get a chemical product (Denote as D) from a given reactant (Denote as A) in such a graph database. It is logically equivalent to find a path from node A to node D what has the largest product(?) of all reaction rate (denote as ki) along the path. A chemist can even choose a reaction path with the safest experiment condition if he filters the reaction condition stored on the edges (Denote as the relationship in a graph database). The chemical interaction database saves a huge amount of time for chemists to search for a potential pathway between reactant and product.

The graph representation also brings convenience to biochemists. The systems biology definition of a network is broader and includes a variety of graphs. The nodes in a network generally represent biochemical components. Some examples include genes and proteins in a transcription network; substrates, organic compounds and so on. For this type of graphs, one Strongly Connected Component (SCC) usually represents a stable group of components that can transform into each other under some conditions. Like the Bow-tie Structure taught in the first lecture, there is a similar structure in the graph representation of biochemical interactions. The components in SCC can be formed from the components that are in the IN set of it. Additionally, the SCC can produce the components that are in the OUT set of it. By using graph representation, biochemists can have a DAG of biochemical interaction where each SCC can be identified as a compound species. They can produce undiscovered biochemist compounds by permuting different SCCs. Therefore,  nowadays scientists are computationally generating a large space of possible biophysical-chemical realistic pathways and then testing them for their potential to exhibit particular biochemical functions.


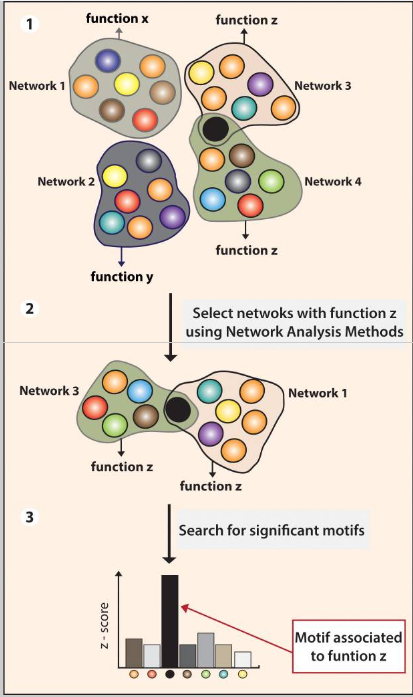
One SCC is denoted as one reaction network in biochemistry

During the past decades, network theory has been proposed to analyze chemical reaction systems and biochemical pathways. An essential question for translating chemical and biochemical reactions into a network model is whether the representation is accurate and whether any information is lost. With the development of modern graph database, modern chemists save a huge amount of time to build and search for a large-scale network representation of chemical and biochemical interactions.

Reference List:

[1] Sandefur, C. I., Mincheva, M., & Schnell, S. (2013). Network representations and methods for the analysis of chemical and biochemical pathways. Molecular BioSystems, 9(9), 2189. doi: 10.1039/c3mb70052f

https://www.ncbi.nlm.nih.gov/pmc/articles/PMC3755892/

[2] Kim, Y., Kim, J. W., Kim, Z., & Kim, W. Y. (2018). Efficient prediction of reaction paths through molecular graph and reaction network analysis. Chemical Science, 9(4), 825–835. doi: 10.1039/c7sc03628k

https://pubs.rsc.org/en/content/articlelanding/2018/sc/c7sc03628k#!divAbstract

[3] Organic Chemistry. (n.d.). Retrieved from: 

https://www.acs.org/content/acs/en/careers/college-to-career/areas-of-chemistry/organic-chemistry.html

Network Analysis of the Stock Market

In class we have discussed many properties of graphs including clustering, graph connectivity, and degree centrality and connectedness. In this blog I will outline the real world use of these properties in stock market analysis.

There have been many attempts to “beat” the stock market for obvious reasons ($). Traditional approaches such as technical and fundamental analysis have their believers and critics. Another approach, based on graph theoretical analysis, is also used in risk analysis and portfolio management. By nature the stock market is correlated because we live in a global economy — no company is isolated. Thus stock markets can be represented as a cluster of companies with edges forming between companies sharing a characteristic. Here we focus on the representation of the stock market as a network based on correlated stock returns. That is, If the absolute difference between the return of two stocks is less than some defined threshold theta, an edge is formed between them.

An interesting result is that after applying community detection algorithms on such a network (such as the Girvan-Newman algorithm as discussed in class), the resulting clusters were consistent with the market classifications as denoted by the Standard Industrial Classification (SIC) system; a classification of industries by 4-digit code. This illustrates that stocks within similar sectors tended to perform similarly. In class we refered to this as communities sharing the same behaviors or “birds of a feather are alike”. Using software to visualize stock return correlations offers an intuitive way to analyze the overall structure of a set of stocks, and to helps to identify key companies/market clusters — this is an important aspect of risk analysis/portfolio management.

This networking model can be applied to stocks listed on the S&P 500 based on rate of return over the time frame July 2007 – February 2009. Snapshots of the network can be taken at smaller time frames i.e July 2007 – August 2007, August 2007 – September 2007, etc. to produce a series of networks depicting the progression of correlation between companies. The interesting result is that looking at the series of networks, you can observe a ‘cascading’ or spreading effect of returns in clusters. This is similar to what we discussed about network security and the spread of malicious software. Thus this network representation of the stock market could be useful in systemic risk and cascade effects prediction.

Note: this time frame represents the approximate timeline of the US Financial Crisis in ’08

Notice the ‘cascading’ effect along the graph at each time frame and how it spreads along clusters

Why network analysis over traditional methods?

Traditional approaches tend to rely on statistical properties such as variance and expected returns over time. However these typically represent localized behavior of one or two stocks and do not represent the behavior of a cluster/community of stocks. A network representation that characterizes stocks in clusters of connected components (industries) gives insight to more macro properties of the market. Properties such as degree centrality and betweeness of a stock can be identified.

A practical example is if Apple (AAPL) suddenly loses 50% of its value: semiconductor, glass screen, and other electronic hardware companies will almost surely experience similar losses soon after in a cascading effect. Network analysis can help to identify these clusters.

Limitations

Note this doesn’t mean you can beat the market with network analysis. Limitations of network analysis are that it doesn’t actually quantify how to actually achieve a better portfolio. Yes it can tell you to diversify so that your portfolio isn’t comprised of stocks all from one cluster, but ultimately it does not consider how much of each stock, at what time frame, and at what prices would be optimal points of entry/exit. Perhaps network analysis properties such as stock connectedness could be used in conjunction with a neural network to formulate a quantitative approach to optimize some return function of dollars.

References

[1] Huang, Wei-Qiang, Xin-Tian Zhuang, and Shuang Yao. “A network analysis of the Chinese stock market.” Physica A: Statistical Mechanics and its Applications 388.14 (2009): 2956-2964.

[2] Sun et al., 2015. Sun, W., Tian, C., and Yang, G. (2015). Network analysis of the stock market.

[3] 许忠好, and 李天奇. “基于复杂网络的中国股票市场统计特征分析.” 山东大学学报 (理学版) 52.5 (2017): 41-48.

Photos courtesy of [2].

A New Class of Virus: Detecting and Classifying Malware

One of the key ideas of has been about approaching analyzing networks as it pertains to things spreading within them. Most notably, understanding social networks can be key to understanding infection and how to deal with it. When we consider properties of graphs such as clustering coefficients, we can apply this knowledge to recognize an outbreak and control spread. However, infection is not limited to people. For example, we read in the blog post Compromised Networks about the malware known as Nodersok/Divergent and ways of preventing network attack by considering the SCCs within the network. Just as important as prevention is detection. We discuss two different graph-theoretical approaches to understand malicious code, one focused on botnet network behaviour and the other focused on code similarity.

One approach using graph-analysis from Šmolík inspects botnets specifically and how they communicate in a network, since botnets are a collection of computers controlled by the creator of malware. The leaving communication of a host is represented as a directed graph. Each vertex is an identifying triplet of (IP address, port, protocol) with a directed edge (i,j) if j was the first connection of the host after connecting to i. One of the key identifying features of suspicious code is the presence of more cycles, since attempts to communicate between a bot and its command and control server. Other notable properties in the graph of communications of infected networks include just the number of nodes in the graph, since the botnet is spreading itself much more than the average program would.

An example of suspicious network structure. Figure 3.1. Šmolík.

Another way of detecting malicious software is by determining their similarity in code to other software, shown in Lee, Taejin, et al. This works by creating a weighted graph where each node is some malicious software and each edge is weighted by similarity. Then, by determining clustering coefficients, we use agglomerative clustering to create communities of malware if they reach a given threshold for local similarity. This type of detection is important not only to know when you have malware on your system but determining similarity can also determine the behaviour of the given virus to prevent further spread.

Figure 5. Lee, Taejin, et al.

References

Šmolík, Daniel. “Graph-Based Analysis of Malware Network Behaviors.” Graph-Based Analysis of Malware Network Behaviors, Czech Technical University in Prague. Computing and Information Centre, May 2017, core.ac.uk/display/84833006.

Lee, Taejin, et al. “Automatic Malware Mutant Detection and Group Classification Based on the n-Gram and Clustering Coefficient.” The Journal of Supercomputing, vol. 74, no. 8, 2015, pp. 3489–3503., doi:10.1007/s11227-015-1594-6.

The Impact of Facebook on Politics

Many years have passed since we have been introduced to the concept of social media, and as 2019 is nearing its end, it has already been 15 years since Facebook has first launched. By now, it should be no surprise that most of us are revealing more personal information to the public than we would have in a world with no social media, or that Facebook is able to get even more data about you than you have ever intended to reveal. Looking back, how has social media impacted the world of politics? The article ‘What Facebook Did to American Democracy’ attempts to put all the pieces together, introducing personality profiling data1.

I’m sure by now, anybody who has used Facebook must have seen (seemingly innocent) online quizzes that ask you for completion to share its results with your friends. This is actually one example of harvesting data by means of psychographic profiling. With such information, users can be divided and then grouped into networks (as we have seen in class). An ethical way to use such data would be to expose to you targeted advertisements, but it can also be used in ways that influence your stance in politics. Through the harvested data, specific political messages are targeted to different segments without anybody realizing; “How does a campaign know what its opponent is saying if ads are only targeted to white Jewish men between 28 and 34 who have expressed a fondness for U2… and who donated to Barack Obama’s campaign?”2 Harvested data can also be used to target you with posts that you want to see; “Pariser … noticed conservative people, whom he’d befriended on [Facebook] despite his left-leaning politics, has disappeared from his News Feed… no conservative links for me.”2

Targeted political messages to communities. Users targeted only by posts that align with their stance. Adding these together, we have a network where a platform (such as Facebook) provides a source of information (targeted messages), all while eliminating and preventing other sources of information (filtered/targeted posts). In essence, we get communities who’s members have strong ties with each other, with few to none weak edges between the communities.

Depiction of Communities

Taking into consideration Granovetter’s explanation of the social and structural role of an edge, the lack of weak edges prevents communities from accessing other sources of information. Couple this with other tactics involving media (such as blowing up fake news3 ), and we can see that large platforms like Facebook have the power to affect the general population’s stance in politics.

References:

(1) Facebook is Killing Democracy with its Personality Profiling Data. Timothy Summers https://theconversation.com/facebook-is-killing-democracy-with-its-personality-profiling-data-93611

(2) What Facebook Did To American Democracy. Alexis Madrigal –https://www.theatlantic.com/technology/archive/2017/10/what-facebook-did/542502/

(3) Heres Why Facebook’s Trending Algorithm Keeps Promoting Fake News. Craig Silverman – https://www.buzzfeednews.com/article/craigsilverman/can-facebook-trending-fight-off-fake-news#.fadKm1WOG

Image: https://ourpangea.files.wordpress.com/2012/04/social-networks.jpg?w=584

Homophily is Present Even in EverQuest II

We have been shown through numerous in-class examples that proximity and homophily play a key role in who we associate ourselves with. Some of the largest factors identified were age, nationality and race. The factors that were found to exist in virtual worlds such as EverQuest II in the study “Virtually There: Exploring Proximity and Homophily in a Virtual World” were proximity, age and game experience. One of the main factors of the study, proximity, was largely attributed to people bringing their real life friends into the game with them to experience it together.

EverQuest II is a Massively Multiplayer Online Role Playing Game (MMORPG) where players need to work together to complete quests and upgrade their characters. (img: https://store.steampowered.com/app/
333890/EverQuest_II__Pain_in_the_Neck_Bundle/ )

The two main types of homophily that were experienced in EverQuest II and highlighted in the study were age and game experience which greatly determined players in-game relationships. Relationships were measured through teaming, messaging, trading and mailing patterns that took place throughout the game. The results showed that players routinely cooperated and communicated with people of similar ages and skill levels. An interesting note from the results was that gender homophily did not originally appear to be present, but upon further inspection it was found that this was caused by the low probability that 2 female players would interact with each other in the game. There are many possible reasons for this, with the prevailing one throughout the study being that most female players were brought in by male partners (boyfriends/husbands) or other males that they knew.

In many ways virtual worlds like EverQuest II emulate the real world since they are built on top of player-to-player interaction. Therefore, seeing homophily present should be of no surprise, but it is interesting nonetheless to see that even virtual birds of the same feather flock together.

Relevant Link
http://dmitriwilliams.com/proximity.pdf

References

Huang, Y., Shen, C., Williams, D., & Contractor, N. (2009). Virtually There: Exploring Proximity and Homophily in a Virtual World. International Conference on Computational Science and Engineering, 4, 354–359.

Measuring Polarization Using Community Detection Algorithms

People are very divided when it comes to certain issues such as politics, abortion, gun-control and same-sex marriage. When two groups have conflicting and opposing viewpoints with very few people holding a neutral viewpoint, it is known as ‘polarization’ in social science. With the rise of social media and technology use, more people are able to voice their opinions online which allows us to analyze which topics cause polarization. 

Why is it important to study polarization? According to the paper (cited below), polarization causes segregation and political conflict. I chose this paper since it tries to study polarization using community detection algorithm which is a topic we learned in class. The paper also shows how their measure of polarization is related to prior work on this matter which used  a measure known as modularity. Modularity works by quantifying homophily and antagonism. Homophily was also studied in this course.

This paper tries to derive a novel approach to analyze polarization compared to prior work on this matter. It is important to understand the concept of antagonism in graphs prior to understanding this paper’s methodology. Antagonism tries to quantify nodes avoiding to connect with nodes of another community. This provides the intuition for the following idea used in this paper. 

In this paper, firstly, the communities are identified using some community detection algorithm. Then the boundary nodes are identified within each of the two communities. This paper defines the boundary node as having one of two properties.

  1. A node v ∈ Gi has at least one edge connecting to community Gj ; 
  2. 2. A node v ∈ Gi has at least one edge connecting to a member of Gi which is not connected to Gj

Finally, they measure the connectedness of these boundary nodes. The less connections between these boundary nodes implies higher polarization.

This paper observes a real world network of opposing views on gun control following the tragic shootings in Sandy Hook Elementary School in Connecticut by analyzing tweets and retweets on Twitter. 

Here, the polarity constant being positive implies there is polarization and negative means very less polarization or surprisingly more cross-connections between boundary nodes.

In short, we can see how community detection algorithm and other concepts from this course can be used to analyze polarization. We also know why it is important to minimize polarization. With continual knowledge and improved algorithms to detect polarization, we can hope to find solutions to this problem.

Reference List

  1. Guerra, P. C., Meira Jr, W., Cardie, C., & Kleinberg, R. (2013, June). A measure of polarization on social media networks based on community boundaries. In Seventh International AAAI Conference on Weblogs and Social Media.

Should you trust your friends?

Do you trust your friends? I know it is obvious that your response will be, “Of course I trust them! Why would I not?”. Yet, take this to the perspective of social networks or communication on digital networks and you might change your mind.

Paulo, the author of Introduction to Cyber-Warfare, states that there are dangers in transitive trust, which is a topic that is covered in class. Transitive trust is when User A trusts User C under the condition that User A trusts User B and User B trusts User C (see Figure 1). This creates a triadic closure among the three users. We will assume that the direct trust is a strong tie, and the transitive trust can be either a strong or weak tie. Paulo references an experiment performed by Thomas Ryan, in which he observes how a fake account spread through social networks and got people to trust it through transitive trust. Ryan created a fraudulent account called “Robin Sage” with made up information and put her profile on LinkedIn, Facebook and Twitter. This experiment provides some interesting results.

Ryan quotes one user messaging “Robin Sage” stating “I’ve never met you, but I saw you had Marty on your Facebook list, so that is good enough for me.” This shows a common action on social media which is that people tend to send friend requests to those who have mutual friends with them, which is a form of transitive trust common on social media. Another type of transitivity is when a person has a lot of connections with highly respected or trustworthy people. People tend to trust that person, even though they have never met or talked to each other in real life. In the experiment, “Robin Sage” has an extraordinary profile on social media platforms, having graduated from MIT and boasting NSA internship experience. Her extraordinary profile allowed her connect with Joint Chiefs of Staff, the CIO of NSA, etc. – which allowed her to gain the trust of many people through a cascading effect.

Figure 1: Trust relationships between three users. A and C has a transitive trust (box 2).

Another interesting thing Paulo references is the “tipping” model, introduced by Laureate Thomas Schelling. This model clearly points out that when there are two people believing or following a trend, their mutual connection will eventually believe or follow that trend as well. The following graph can give you an idea on how your friends who you trust can eventually influence everyone on what they believe.

Figure 2: Box 1: only two people adopt the trend; Box 2: a white node trusts the two shaded nodes and it adopts the trend as well, turning it into a gray node. Box 3, 4: The action cascades.

Let’s go back to Ryan’s experiment. If we apply the “tipping” model on that experiment, provided that there is a network that indicates their connection (nodes are users, and edges between them means they are friends, or they trust each other), then, from the above diagram, a shaded node represents a user that trusts “Robin Sage” as a legitimate person, which is an effect that cascades throughout the network. From box 1, we can see there is a white node that trusts two gray nodes. The two gray nodes can then convince the white node to trust “Robin Sage” as a legitimate person, due to the “dipping” model. This action repeats recursively within the network, and eventually the whole network will believe that “Robin Sage” is a real person, even though they have never met her in person. This spread in the network is justified by the Strong Triadic Closure property.

As an analogy, consider a scenario where one person tries to spread a false message and one of your friends trusts his/her word. Your friend will bring that message into your network and gradually spread it to everyone. You cannot easily determine if the message is true or not, but since your friends trust it, you will generally trust them.

Figure 4: Trust* relationship.
Figure 3: The PGP web of trust. Users can quickly verify the validity of digital signatures through transitive trust.

The PGP web of trust is a real world example that has this kind of issue, where you can never know if your friends trust the right person. It is dangerous to trust your friend on the Internet without really knowing them, in the perspective of the web of trust. If one of your friends trusted a malicious person, by the transitive trust property learned in class, you will trust the fraud as well. Transitive trust in PGP may bring us the convenience of quick verification but it also creates potential trust issues in the network. The best practice when dealing with trust online is only to trust people that you really know in person, and to exchange your PGP keys in a secure way.

So, ask yourself again: Do you still trust your friends on the digital network?


Citations:

Detecting Credit Card Fraud: Graph Analysis and Visualization

Software companies such as Neo4j and Cambridge Intelligence, provide network visualization products so that organizations could apply social network techniques to analyze data. They advocate for fraud prevention, and have worked with organizations all over the world, including law enforcement. As credit cards have become an increasingly popular form of payment worldwide, these software companies provide insight on the importance of graphing visualization tools in detecting credit card fraud. This is an interesting topic to discuss because of how widespread the problem has become globally and how complex it is to solve it. Many may argue that preventing all fraud incidents is not possible, as it is similar to the cat and mouse scenario, where both parties will always try to be one step ahead of each other. However, there are many innovative graphing tools today, along with machine learning and artificial intelligence algorithms that analysts can use to help prevent complicated criminal activities that were previously undetectable.

Detecting fraud is difficult because of constantly changing tactics that criminals use and their increasingly sophisticated strategies. Fraudulent activities could generally be categorized as two different kinds, known and unknown fraud. Known fraud is an activity that analysts have identified before and can be detected by defined algorithms and automation. Unknown fraud is an activity that needs to be detected, as it has not been encountered before. 


Using graphing technology, the large amount of data that is often incomplete and complex could be rearranged into a network, which analysts could then use to extrapolate or interpolate patterns and find anomalies that otherwise could go unnoticed.  While many algorithms are able to detect known fraud scenarios, detecting fraud when criminals work together and collaborate prove to be much harder to expose.  

Identifying credit card fraud involves studying the relationships between accounts, transactions, events and people. By displaying these entities in a graph, it would be easier to pinpoint the point of origin and common denominators. Additionally, Cambridge Intelligence provide solutions where noise data could be filtered out to highlight underlying patterns and features to support temporal based analyses.


Numerous graphing analyses and techniques can be used to detect fraud. In the case of credit card fraud, multiple network relationships are created by criminals to hide fraudulent activities. In a network, there may be thousands of credit card users and, for example, a new client might be interested in applying for a credit card. Using graph visualization tools to rearrange data, analysts will be able to identify networks that the client is a part of (community detection). Through identifying related clusters and the connectivity of their network, analysts can determine how likely a client is to be a fraud.  As an example, a basic indicator of potential fraudulent activity is if the client is trying to apply for a credit card with a SIN number that is the same SIN as a few different other accounts, but those accounts are under a different name or already marked as fraud. Thus, an investigation could be initiated. A lot more other attributes could be analyzed (i.e. phone numbers, addresses), but generally it is more simple and fast to follow the network connections than a brute force approach. By doing further investigations, such as calculating the node degrees of the social network, you may be able to find the person with the highest influence or perhaps which specific attributes prove to be the most influential in the network. This is useful because it will help in breaking down potential fraud rings, or preventing one to form. It may be the case where the neighbouring nodes that are one edge away from the client in the graph are not known as frauds. However, further analyses may reveal a few frauds 2 edges away from the client. Further more edges away, and a pattern may start to form and show that the client may be involved in some fraud activity. The goal of these graph analyses and identifying such patterns are to prevent fraud before it occurs.

In a similar way, these graphing analyzation and visualization techniques could be used to detect Insurance fraud and Bank fraud.


Fraud costs businesses billions of dollars each year. As crimes become harder to detect due to the level of complexity and sophistication, it is important for data tools and analyzing techniques to also continue to develop and innovate, with the goal of detecting such fraudulent crimes so it can be prevented.  Graph technology and social network analyses help take part in minimizing such losses.

Article:

Sadowksi, Gorka, and Philip Rathle. “Fraud Detection: Discovering Connections with Graph Databases.” Neo Technology, Neo Technology, Jan. 2015.

Relevant Links:

https://neo4j.com/graphconnect-2018/session/graph-technology-ai-machine-learning

How hard is it to fight a fire?

Suppose a wildfire starts in a forest (like in the Amazon rainforest) and you have a limited amount of resources to fight the fire as it spreads throughout the forest. What is the best strategy you should deploy so that you can maximize the number of trees you save before the fire is distinguished?

https://rainforestpartnership.org/amazon-wildfires/

This is the so-called Fire Fighter Problem, it has been discovered since 1995 and is still studied and experimented till today. It’s easy to see that we can transform the description of this problem into a network where

  • nodes = trees in the forest
  • edges = exists if a tree is next to another
  • S = the sources of the fire
  • Strategy = the way in which “firefighters” are deployed to fight the fire

and the goal would be to save the largest set of trees in the forest.

https://slideplayer.com/slide/4290990/

A keen student might attempt to solve this optimization problem with techniques we learn(ed) in CSCB63 and CSCC73. However, it turns out that the Fire Fighter Problem is a NP-hard problem, which means that we have not yet figured out an efficient solution that can deterministically solve every instance of this problem (without proving P=NP first!).

In my opinion, this result actually have a huge significance in our lives. If we refer to our classmate Sol and Jayden‘s blog posts — Sol investigated on the disease spreading network and Jayden on the computer virus network. Both of their problems can be seen as analogous to the Fire Fighter Problem. This implies that it is mathematically hard to come up with a very efficient algorithm to vaccinate people in a network or come up with a protocol to prevent a large network (maybe a SCC in the web) from being infected by a virus or malware.

From Netflix’s “Inside Bill’s Brain” documentary, Bill Gates talked about how it was extremely difficult to exterminate Polio in Africa as figuring out an efficient vaccination strategy was hard. Although this is unfortunate, it is not surprising from our insight of the Fire Fighter Problem and further confirms our intuition on this family of problems.

In summary, we see how we can describe a real world problem into one that involves networks, and by understanding from mathematical results, we can infer how difficult it is to implement a strategy in a real world system.

References:

Social Network reveals privacy

In modern-day, Social Network has become one of the most important features in daily life applications. People communicate and share their personal information on social network platforms such as Facebook, Twitter and etc. Have you ever noticed that social media such as Facebook has people you may know, this is through Triadic Closure in which means that if A knows B and B knows C then it implies A and C might know each other or might meet each other in the future.

This is an example of how the social network connects you with some people that you can potentially build a friendship with. Is this a good thing? It might be beneficial if you look into the perspective of extending your social network between you and other individuals in the digital world. It provides you with greater opportunities to meet people who might be helpful in your carrier or private manner. Build up your knowledge and track the newest information about the world.

The concept of triadic closure does not only apply to the social network, but also other fields. For example, in cybersecurity, this is called the Web of Trust, which means if you believe in your friends then their friends can be trustworthy. This transitive trust is easily applied to the Triadic closure.

On the other hand, this can be dangerous in the sense of revealing your personal information to the public. Since on most social media, users are able to search and look into your profile page, your information is easily leaked. It is also the case when you are browsing some webpages, it requires you to register an account with personal information such as email address, name, and contact information in order to get access to the content. In social media when you repost or like/dislike a post your interest might be known by other people. It is easy to find post that might not be true, It becomes untrustful.

In a recent article by the University of Vermont points out that social media privacy can be at risk even if you have deleted or never had an account. That is, the online posts and words from your friends have high potential predictive accuracy of your future activities without the need for your data. This means that by registering on social media, you are not just giving your information but at the same time your friends too. The result of this is that outside of the social media your friend who does not use the platform might be founded by other individuals. Many of the platforms even have access to your contact lists to create fake profiles which means that they do not even exist on the social network and ask people to invite them into the platform.

In conclusion, the creation of social networks is indeed a beneficial and phenomenal move for humankind, however, due to the ever-increasing size of the social network, privacy leak has become one of our primary concerns and more actions needs to be taken in order to maintain a healthy and clean environment.

Reference:

On Facebook and Twitter Your Privacy Is at Risk — Even If You Don’t Have an Account, Study Finds.” ScienceDaily, ScienceDaily, 21 Jan. 2019, https://www.sciencedaily.com/releases/2019/01/190121115354.htm

HutsonJan, Matthew, et al. “People Can Predict Your Tweets-Even If You Aren’t on Twitter.” Science, 22 Jan. 2019, https://www.sciencemag.org/news/2019/01/people-can-predict-your-tweets-even-if-you-aren-t-twitter