Water Use and Game Theory

Game theory is quite interesting topic and has a wide range of application in various fields ranging from math, business, to life sciences. Through this blog I would like to share an interesting application of Game theory. This is ‘Selection of sustainable municipal water reuse applications by multi-stakeholders using game theory’.          

This research was conducted by Gyan Chhipi-Shrestha, Manuel Rodriguez, Rehan Sadiq. The goal of the research was to successfully show how Game theory (combined with Multi-criteria decision Analysis – something which is not in scope of our course) can be used to solve the complex, conflict involving decision of water reuse. Water reuse means using the treated (i.e. making it safe for reuse) municipal waste-water (also known as reclaimed water) for various purposes such as toilet flushing, irrigating golf courses/ gardens/ parks, etc. How and where to use this reclaimed water has different impact on different group of stakeholders such as municipality, citizens and the farm operators, making sustainable selection of water reuse a complex decision.

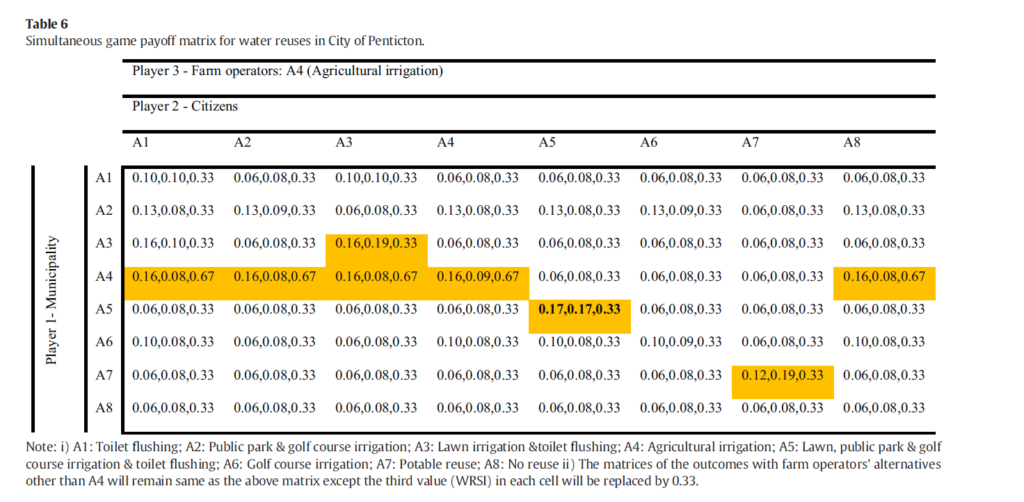
The sustainable of water reuse was assessed under three criteria – environmental (ex – carbon footprint, fresh water issues, etc), economic (cost of maintaining the water infrastructure, etc.) and social (acceptance from citizens, health risks, etc.) After these evaluations and collecting data for these stakeholders, they came up with 8 options/applications of water reuse such as toilet flushing, agricultural irrigation, potable use, etc. They then converted this data into a payoff matrix for a 3-player game which looks as follows –

Since water reuse benefits the government as well as the citizens, they considered this game as a co-operative game i.e. like the coordination game as we saw in this week’s lecture. To reach to the solution of this game, they made use of Pareto optimality. A strategy say s is Pareto optimal ”if there does not exist other strategy that dominates s.” In this case optimality is reached with mutual sharing of costs by the stakeholders for a specific water reuse application. The research reached to a conclusion that municipality will have the benefit of $35/household/year and also the citizens needed to spend $100/household/year for the dual plumbing of toilet and lawn for reclaimed water.

Thus, it can be seen that how powerful and versatile the Game Theory is and can be used in various areas and can also be combined with other ways of analysis/concepts.

REFERENCE

Chhipi-Shrestha, G., Rodriguez, M., & Sadiq, R. (2019). Selection of sustainable municipal water reuse applications by multi-stakeholders using game theory. Science of The Total Environment, 650, 2512–2526. doi: 10.1016/j.scitotenv.2018.09.359

Network Analysis to evaluate impact of animal movements on pathogens.

Networks and their analysis is one of the core topic of this course for network analysis can prove useful and powerful in various fields such as biology, psychology, computer sciences, social sciences, etc. During the lectures, we saw how network analysis on Facebook data (or any other social media platform) to can help us gain knowledge about friendships and characteristics of social circles on the platforms. We also saw how networks and strong/weak ties can provide us with meaningful insights on job searching/hunting. These are just few of the many uses and applications of the network analysis. Through this blog, I would like to share an interesting application of network analysis which I came across. It is “Combining network analysis with epidemiological data to inform risk-based surveillance: Application to hepatitis E virus (HEV) in pigs.”

This interesting research was conducted by Morgane Salines, Mathieu Andraud and Nicolas Roseab. The goal of the research was to “evaluate the impact of animal movements on pathogen prevalence in farms and assess the risk of local areas being exposed to diseases due to incoming movements (the transportation)” and they combined Network Analysis with epidemiological data to achieve the same. They collected data consisting of pig moments from farms, slaughterhouses, etc. for the period of a year (January – December 2013) from the French Ministry of Agriculture.

            Now comes the interesting part of how they designed or defined a network or a graph. They modelled the data into directed networks which were aggregated on the data for the entire year. The nodes of the network represented the pig holdings, i.e. the farms, slaughterhouses, trade plants, etc, while the movements (all the transportations) between them were represented as directed links. They then calculated various centrality measures such as in-degree, out-degree, betweenness, etc for 178 farms. The graph below shows a sample network where U stands for Unloading pigs and L for loading pigs.

After the preliminary work was finished, the researches then conducted “a univariable analysis to assess the statistical link between each explanatory variable (i.e. the farms’ centrality metrics) and the outcome (i.e. the unbiased within-farm HEV seroprevalence).” PS – HEV seroprevalence was defined as the “number of HEV-seropositive pigs in relation to the total number of pigs sampled in the farm.” After this analysis, they successfully plotted the risk indicator for each of the French departments which looked like this.

Thus, it can be concluded that simple network (and statistical) analysis along with epidemiological data can effectively help the surveillance programs by indicating the risk and thus helping prevent diseases. The network they modeled was very simple and was something that we learnt in the C46 class.


REFERENCE –

MorganeSalinesab, MathieuAndraudab, & NicolasRoseab. (2017, November 20). Combining network analysis with epidemiological data to inform risk-based surveillance: Application to hepatitis E virus (HEV) in pigs. Retrieved from https://www.sciencedirect.com/science/article/pii/S0167587717305937.