The Prisoner’s Dilemma during the Cold War

The Prisoner’s Dilemma can be explored throughout many historical conflicts. The concept can apply to a large range of scenarios, from small personal decisions to massive world wars.

A prime example of the Prisoner’s Dilemma can be seen during the Cold War between the United States and the Soviet Union. The Cold War was a nuclear arms race between the two opposing factions. Each country had two options: to arm or disarm their nuclear weapons. The possible outcomes of these choices between the United States and the Soviet Union is displayed by the following table:

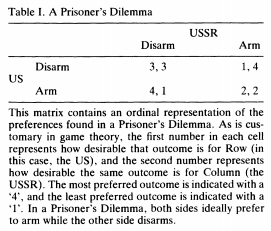
It is easy to observe that it is a strictly dominant strategy for both parties to arm their nuclear weapons, because it would result in the best outcome for both choices of the opposing party. This is intuitive, because if, for example, if the United States arms their nuclear weapons, then it would be in the Soviet Union’s best interests to match their opponent’s military strength and also arm their weapons, in order to avoid annihilation and gain the opportunity to counterattack. In the other scenario, where the United States disarms their weapons, then the Soviet Union would be inclined to arm their weapons for military superiority. In both cases, arming is the better choice. The same mirrored argument applies to the United States reacting to the Soviet Union. Naturally, both countries chose to arm their weapons, and this large-scale application of the Prisoner’s Dilemma became known as the Cold War.

https://www.socialpsychology.org/pdf/jpr1993.pdf

The Role of Networks in Disease Prevention

The understanding of networks is crucial in regard to the process of disease prevention. The importance of the effects of wind in the spread of disease is highlighted in an article by Joel H Ellwanger and José A B Chies at, thelancet.com

The channels of wind that carry the airborne vectors, such as mosquitoes, may be interpreted as a directed link in a network. The spread of Malaria is affected by wind speed and direction (Chies and Ellwanger). The links may be weighted with respect to the strength of the wind, number of mosquitoes, potency of the virus, etc. Since it would be near impossible to represent every organism as a node, the nodes of the network would be a geographic segment of hosts of the virus, which includes animals. For example, villages, towns, cities, forests, natural habitats, etc.

An example graph of the spread of airborne diseases.

This network may be converted into a mathematical graph, such as those seen in CSCC46 at the University of Toronto. Then, graph theory and analysis may be conducted on such graphs. The clustering coefficient is the measure of how much clustering occurs among nodes in a graph. The degree of a node is how many connections it has to other nodes. By analyzing the clustering coefficient and degrees of nodes on smaller portions of the graph, common sources of the virus may be deduced, as nodes would be clustered more densely around these sources. A breath first search of the graph, starting from any one of the sources, can be used to see how airborne diseases spread throughout time. Then, preventive measures may be put in place around these sources and other densely clustered areas to prevent the future spread of the disease.

By analyzing the networking behind the spread of airborne diseases, future outbreaks of these diseases may be more efficiently prevented. This study highlights the importance of network analysis and its countless applications to real world problems.

Russell, D. A., and Michael Winterbottom. “Wind: a neglected factor in the spread of infectious diseases” The Lancet, Elsevier Inc., 1 November 2018, https://www.thelancet.com/journals/lanplh/article/PIIS2542-5196(18)30238-9/fulltext