CS:GO A ‘Short’ Game Theory Analysis

If you’ve ever been interested in any esports, then you most definitely have come across ‘Counter Strike: Global Offensive’ (CS:GO). CS:GO is a very popular first-person shooter, released in 2011 to replace it’s predecessor ‘Counter Strike Source’, with just under 1 million concurrent players worldwide. There are multinational tournaments held with over $8.6 million in prize money released this year.

With well over 500 competitive teams all over the world, there are many people that make a living off of this esport. Now the question boils down to: what makes a team such as ‘Astralis’, currently the number one ranked team in the world, so successful in what they do? We will be taking a short glance into what a game analyst would need to look at to help teams make quick split second decisions to ensure that they have the best possible outcome for their team.

Counter Strike: Global Offensive cover art
Counter Strike: Global Offensive Cover Art

I will first give a quick rundown of how the game works. Two teams of 5 in-game players each face off for 30 rounds – or more if they tie at 15-15 – where each round lasts 1 minute and 55 seconds. In the first round, each player is awarded $800 to buy armor/utility grenades/weapons to help them win the round. Upon each kill, and outcome of the round, each player is awarded money to use for the following round. The two teams are split as Terrorists and Counter-Terrorists where the objective of the Counter-Terrorists is to hold and defend a ‘site’ – 2 per map – and the objective for Terrorists is to plant a bomb at a ‘site’ and ensure that it goes off before the round ends.

We will try to see what a game analyst would have to consider when doing their job. We will consider a key moment in the game: defending a site, and attacking a site. To make things simple, we will consider this game as having two players – Terrorists and Counter-Terrorists – and we will assign payouts similarly to a zero-sum game where players are awarded a sum of 1, representing their chances of winning the round. One thing to note is that there are many choices that a team can make – too many to really organize in a neat fashion. Such decisions go down to what equipment is bought/caried over from the previous round to a single footstep that is made in the game. The number one thing the game revolves around is information. Whichever team has the most information as to the other team’s status has control of the round.

Very basic payout matrix example

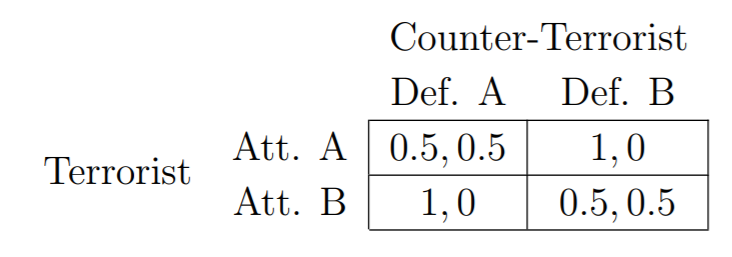
The payout matrix seen above is an extremely rudamentary payout matrix of what a game analyst may build to help teams decide on what kind of strategy is the best strategy for them at any round. Now, in order to make this payout matrix more accurate a game analyst would have to tailor it to specific teams, as each player has an individual skill level. The ‘decisions’ are also not as simple as ‘Attack A’ or ‘Defend B’. There are many decisions that are made by each player in each round that may have an effect into rounds that follow. Each of these decisions would change your expected payout for the end of the round. Being able to identify the outcome of each decision that a player makes, and which further decisions will lead to the best outcome can determine the round. Now a players decision can also be because of some information that they have recieved of a decision from the other team within a round. This should also incoporated to ensure nothing is missed.

The purpose of this was to show how what we’re learning can be taken and applied to the real world and how professional gaming teams would nead data such as this to give them a better advantage over their opponents. Albeit, my example was extremely oversimplified against what a real payout matrix for a round would look like, I hope that my explanation showed how complex such payout matrices can get within the professional world, and more generally, just how such matrices are used professionaly.

Bibliography

The Effects of a Broken Network

“We cannot stop natural disasters but we can arm ourselves with knowledge: so many lives wouldn’t have to be lost if there was enough disaster preparedness.” – Petra Nemcova (4)

The world has finally begun to act in preventing climate change. Unfortunately, the damage has already been done, and what are defined as natural disasters have seen a dramatic increase within the past 50 or so years (1).

Something that I know for a fact I take for granted, and I’m sure many others do as well, is our infrastructure that we have within Toronto. Such infrastructure includes: our road systems, power grid, drainage systems, sewage system, internet lines, and many more. Thankfully, Toronto is situated in a very key geological region where we do not see many natural disasters such as hurricanes, floods, or forest fires; but many highly densely populated areas of the world are in these danger zones (2).

One of the reasons as to why these disasters can become so catastrophic in terms of monetary damage, and for the local population, is due to the effects that they have on the local infrastructure. There are times when even a failure of a key piece of infrastructure can cause such an event – such as a dam breaking (3). Without access to this infrastructure, locals are unable to deliver aid to the afflicted, or even worse, notify residents of certain events that can put them in danger or affect them in some way.

Thankfully, the local population usually has some kind of remediation plan set in place that would help mitigate the damage. Although these infrastructure systems are built to be resilient, they are not immune.

How does any of this relate back to what we’ve been discussing within CSCC46 you may ask yourself? As we’ve already explored, infrastructures such as the internet can be treated as a network. I will now introduce a network that has not yet been covered by the course: a lattice network. You may think of it as a matrix where each index is a node that has edges connecting to its direct index neighbours, as well as, the index one level above and one level below. In mathematical terms we can conceptualize this as the following: For a given nxn matrix A, an index a_(i,j) has an edge to the following set {a_(i, j – 1), a_(i, j + 1), a_(i + 1, j), a_(i – 1, j)}. Back to the original question, many infrastructure systems can be plotted using such a lattice network, think of road systems, sewage systems, or power grids as examples.

When speaking about such a lattice network, a natural disaster has the capability of breaking such a lattice structure, thus disabling the local infrastructure. Such an event is called a localized attack. I came across a very interesting article (Inspiration) that explored recovery assessments of such networked infrastructure under such an attack. Understanding the best way – in terms of efficiency, cost, and possibly human lives – to repair such a network can prove to be quite useful when it comes to planning ahead. This ‘best way’ is what is referred to as resilience.

The article explores different recovery strategies that would be able to recover from such an event, as demonstrated in the image below. The Periphery Recovery strategy targets the most populous nodes – in terms of people served – before going to repair the attacked node – we will call this the root node. The Preferential Recovery strategy targets nodes that that have edges leading to the most populous nodes. And lastly, the Localized Recovery strategy that assigns a certain max weight w to the root node, and then some weight w – d where d is the distance away from the root node and basically works in a Dijkstras’ fashion to repair the root node as the target in hopes of restoring the full network.

The article further explores something called the resilience metric Φ which is used to analyze the resilience of a network given some localized attack and can be used to create a resilience-based optimization model – using the strategies listed above – in comparison to some existing network.

Infrastructures 04 00011 g006 550

An example was given where a water distribution system was used to demonstrate such an analysis. Meant to stop propagation of issues resulting from the failure of the water distribution shortage and to bring back the system in the most efficient way to ensure its resilience is maximized.

I won’t bore you with the math, but this was simply a small look at the potential that network analysis can have to strengthen existing infrastructure and understand how to maximize it’s resilience towards localized attacks which can be the difference between life and death during a natural disaster.

I end this blog post with some parting thoughts. Our infrastructure that we’ve put in place is responsible for getting you your water, your heat, your electricity, that most of us take for granted. If such a localized attack were to occur as result of a natural disaster, or other means, our number one priority should be in restoring this network to ensure it has no further cascading negative effects on it’s populous.

Inspiration: Afrin, T., & Yodo, N. (2019). Resilience-Based Recovery Assessments of Networked Infrastructure Systems under Localized Attacks. Infrastructures4(1), 11.

Citations:

  1. Hannah Ritchie and Max Roser (2019) – “Natural Disasters”. Published online at OurWorldInData.org. Retrieved from https://ourworldindata.org/natural-disasters
  2. Dillinger, Jessica. (2018, September 26). Countries Most Prone to Natural Disasters. Retrieved from https://www.worldatlas.com/articles/countries-with-the-deadliest-natural-disasters.html
  3. CNN Wire Staff. (2010, July 24). Dam fails in eastern Iowa, causing massive flooding. Retrieved from http://www.cnn.com/2010/US/07/24/iowa.dam.breach/index.html
  4. Petra Nemcova Quotes. (n.d.). BrainyQuote.com. Retrieved October 24, 2019, from BrainyQuote.com Web site: https://www.brainyquote.com/quotes/petra_nemcova_426837