
Machine learning is being used in countless different fields for a variety of different purposes. In order to develop the necessary machine learning models for these applications researches need to gather large amounts of data to train and test the model on. As with any other field, there will be malicious attackers who wish to compromise the model. The attacks where the malicious attacker tries to control a portion of the data used to train the model is called a poisoning attack. These malicious data points may hinder the accuracy of the model and prevent the model from properly analyzing the genuine data.
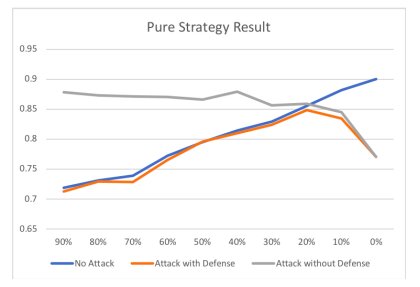
Y-axis shows % of data removed by defense
Some researchers have decided to use game theory to model the poisoning attacks and they were able to conclude that there is no pure strategy Nash equilibrium for this problem. As seen in the figure above after around 20% of the data is removed the defense does not improve the accuracy of the model, and instead harms the accuracy as the amount removed increases. Instead they found a mixed strategy Nash equilibrium for the attacker which they better protected the model and maintained a higher accuracy.
Resources:
https://techxplore.com/news/2019-06-game-theory-poisoning-scenarios.html
Y. Ou and R. Samavi, “Mixed Strategy Game Model Against Data Poisoning Attacks,” 2019 49th Annual IEEE/IFIP International Conference on Dependable Systems and Networks Workshops (DSN-W), Portland, OR, USA, 2019, pp. 39-43.
