The Power of Words

Most people don’t create language on purpose. We learn it, from our parents, our peers, nowadays from the internet. In addition, when we use language, whether spoken or in writing, we don’t consciously distribute words according to some statistical model. So why do natural languages such as English follow a power law distribution so closely?

Zipf’s Law is a model used to describe empirical data that states that the number of the occurrences of an event is inversely proportional to its popularity. That is, if an element’s frequency has frequency rank r, we have some constant factor C and exponent alpha such that

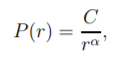
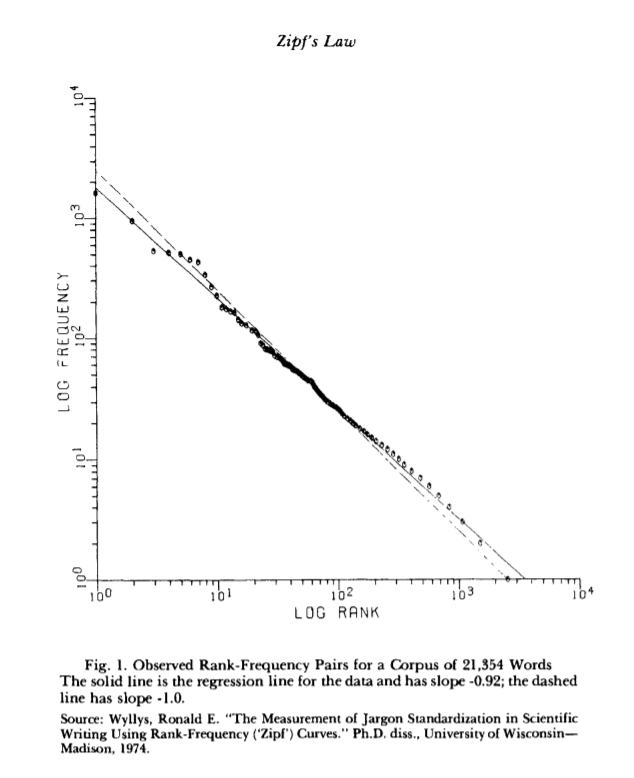
If we arrange English words found in texts by order of their popularity, for example, at the beginning of the list, we get the, be, a, and, of, etc, these words will closely follow this distribution. According to Li, we have C approximately 0.1 and alpha approximately 1. That is, the most common word occurs 1/10th of the time, the next most common word occurs 1/20th of the time, etc. This is follow more closely by more common words since they are guaranteed to be more frequent. While we would expect some distribution where where the words with the highest frequency rank have the most occurrences, why this would follow a power law is not obvious.

Zipf proposed that humans follow the principle of least effort, that is, speakers of a language will put in only as much work as necessary to convey intention through talking. This isn’t done on purpose, but as a result, there is an equal distribution of effort where more general words are used much more often. However, this doesn’t completely explain the phenomenon.

photograph by Tjo3ya, distributed under CC BY-SA 3.0

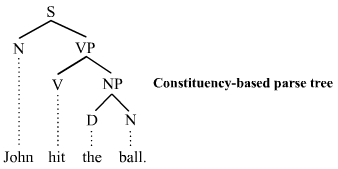
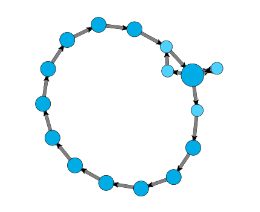
We can consider the network structure of this problem. Like many human processes, language can be modeled using graphs. In particular, parse trees can describe not only the structure of sentences, but how humans think about creating those sentences. Again, while not deliberately done by people, people structure their thinking in terms of phrases such as noun phrases, verb phrases, etc. The most common words are used throughout these different types of phrases. Thus, we can expect to see frequency rank and number of occurrences follow some sort of log-log structure, such as in Zipf’s law and therefore a power law distribution.

References

Adamic, Lada A. “Zipf, Power-Laws, and Pareto – a Ranking Tutorial.” Zipf, Power-Law, Pareto – a Ranking Tutorial, Information Dynamics Lab, HP Labs, www.hpl.hp.com/research/idl/papers/ranking/ranking.html.

Li, W. “Random Texts Exhibit Zipf’s-Law-like Word Frequency Distribution.” IEEE Transactions on Information Theory, vol. 38, no. 6, 1992, pp. 1842–1845., doi:10.1109/18.165464.

Wyllys , Ronald E. “Empirical and Theoretical Bases of Zipf’s Law .” Library Trends, 1981, pp. 53–64., doi:10.1.1.562.5217.

Zipf, Human Behavior and the Principle of Least Effort

A New Class of Virus: Detecting and Classifying Malware

One of the key ideas of has been about approaching analyzing networks as it pertains to things spreading within them. Most notably, understanding social networks can be key to understanding infection and how to deal with it. When we consider properties of graphs such as clustering coefficients, we can apply this knowledge to recognize an outbreak and control spread. However, infection is not limited to people. For example, we read in the blog post Compromised Networks about the malware known as Nodersok/Divergent and ways of preventing network attack by considering the SCCs within the network. Just as important as prevention is detection. We discuss two different graph-theoretical approaches to understand malicious code, one focused on botnet network behaviour and the other focused on code similarity.

One approach using graph-analysis from Šmolík inspects botnets specifically and how they communicate in a network, since botnets are a collection of computers controlled by the creator of malware. The leaving communication of a host is represented as a directed graph. Each vertex is an identifying triplet of (IP address, port, protocol) with a directed edge (i,j) if j was the first connection of the host after connecting to i. One of the key identifying features of suspicious code is the presence of more cycles, since attempts to communicate between a bot and its command and control server. Other notable properties in the graph of communications of infected networks include just the number of nodes in the graph, since the botnet is spreading itself much more than the average program would.

An example of suspicious network structure. Figure 3.1. Šmolík.

Another way of detecting malicious software is by determining their similarity in code to other software, shown in Lee, Taejin, et al. This works by creating a weighted graph where each node is some malicious software and each edge is weighted by similarity. Then, by determining clustering coefficients, we use agglomerative clustering to create communities of malware if they reach a given threshold for local similarity. This type of detection is important not only to know when you have malware on your system but determining similarity can also determine the behaviour of the given virus to prevent further spread.

Figure 5. Lee, Taejin, et al.

References

Šmolík, Daniel. “Graph-Based Analysis of Malware Network Behaviors.” Graph-Based Analysis of Malware Network Behaviors, Czech Technical University in Prague. Computing and Information Centre, May 2017, core.ac.uk/display/84833006.

Lee, Taejin, et al. “Automatic Malware Mutant Detection and Group Classification Based on the n-Gram and Clustering Coefficient.” The Journal of Supercomputing, vol. 74, no. 8, 2015, pp. 3489–3503., doi:10.1007/s11227-015-1594-6.