Bees

From crops to our tables, our food would not be as prevalent if these tiny winged animals did not exist. Each bee has a responsibility to keep the hive alive, and to do so, pollinate plants and crops, which we use to sustain our food production. Bees form pollination networks to flowers and other possible pollination targets which dictates the path that bees can take to each group and complete their tasks. However as of recent, the population of bees have been steadily decreasing, so this article “Graph theoretical modelling and analysis of fragile honey bee pollination networks” attempts to analyze the relationship of disappearing bees and the destruction of these pollination networks.

In this article, researchers D. Pandiaraja et al. have attempted to construct multiple directed graph models to illustrate the various networks that bees have with pollination targets. This diagram is a basic definition of the network that is trying to constructed.

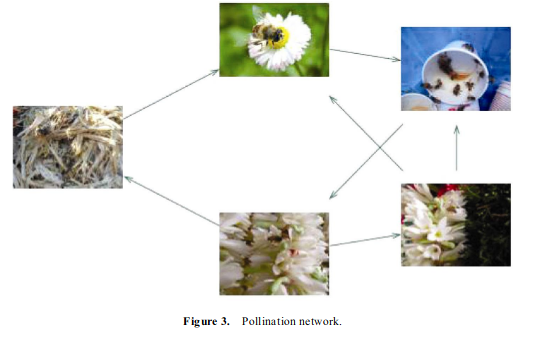
In this graph, they’ve set some definitions to define the network, such as the graph P = (V, A) with vertices V associated to flowers and A is the set of arcs. where arcs are edges that point forwards and backwards. This graph P is connected if every pair of vertices has at least one path to every other flower. Furthermore, the graph P is stable if every flower x, y such that there is a path (x, y) and (y, x) with no intermediate flower in the middle. This can be partially stable if there is either a path (x, y) or a path (y, x). The maximum set of arcs that can occur is P – V where P is completely stable or partially stable.

From these definitions, they’ve come up with some pollination networks:

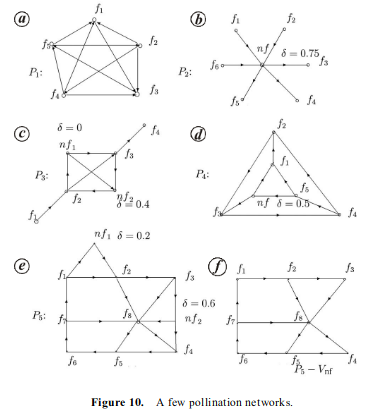
Some things they’ve noticed is that P1, p4, p5 becomes compromised with the loss of a single flower. When multiple arcs are lost within a graph, the amount of possible paths dramatically decrease and bees can lose their ability to actually pollinate enough flowers to sustain their hive. There are dominating flowers who have the largest cardinality in this network that can collapse the entire pollination structure if they are removed.
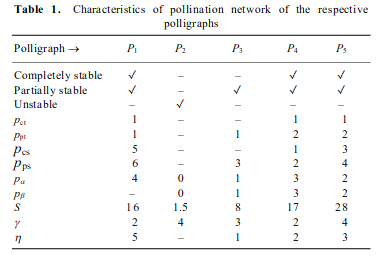
Where:
Pct is threat to a complete graph
Ppt is threat to a partial graph,
Pcs is the max cardinality for a complete graph
Pps is the max cardinality of a partial graph
Pa is the minimum number of arcs required to make a complete graph disconnected
Pb is the minimum number of arcs required to make a partial graph disconnected

Source:
https://www.currentscience.ac.in/Volumes/107/12/1988.pdf

Social Dolphins

You’ve might have read articles on the news or blogs about how dolphins are very similar to humans and they way they behave. Dolphins have a naturally friendly relationship with humans and many dolphins and human interactions have been amiable. Given their social aptitudes, many have wondered how they interact with each other. Dolphins can form friendships and form their own social networks in which they find comfort associating within. This also brings up the social hierarchy in the roles that each dolphin plays in their social circle and where each dolphin fits in within their miniature society. While dolphins can’t come in to do interviews or fill out surveys, David Lusseau and M. E. J. Newman analyzed these relationships to find measures of association and behavior of a group of bottle-nose dolphins in New Zealand.

HTWD1X Bottlenose Dolphin (Tursiops Truncates)

Lusseau and Newman started by determining the communities and modeled a graph of betweeness of an assemble of dolphins through Girvan Newman and then identifying the critical dolphins that keep the community together, and the result of these groupings that create homophily within the entire group structure. While the analysis of humans brings upon many concrete statistics that can be compared such as age, race, gender, occupation, etc, dolphin can only be measured in age (which was mostly estimated) and gender (which was observed).

This is their findings presented through a Girvan and Newman algorithm, finding and identifying communities. Males are represented as squares while females are circles. Ones that could not have their gender identified are triangles. In this diagram, they concluded that there 2 major communities, with 1 split into 3 sub communities. The black shaded group forms one community while all other nodes form another, splitting between smaller sub communities that interact within the their own group more frequently.

This graph shows the dolphins that the center of these communities and have a betweeness greater than 7.33 . These dolphins marked by the filled in shapes are the “brokers” between communities that will interact with other communities as well. They found that when sn100 was away, the 2 communities almost never interacted and drove the 2 groups apart.

We can see that even dolphins have exhibit homophily and will stick within their own group of friends when presented and it is interesting to see how close dolphins and us are alike.

References

  1. Lusseau, D., & Newman, M. E. J. (n.d.). Identifying the role thatanimals play in their socialnetworks. Retrieved October 23, 2019, from https://www.ncbi.nlm.nih.gov/pmc/articles/PMC1810112/pdf/15801609.pdf.