Human is a social animal. We often seek to join communities with similar interests, values and beliefs as we do. In communities, we also constantly adopt new information and new behaviors from others. Depends on how the network structure, the spread of a behavior might be different across the population.
In class, we have learned two hypotheses about how network structure affects the spread of behavior. The “small world” topology says the strength of weak ties can spread the information or a behavior father and quicker than a network which is highly clustered. Long ties connect people who do not have common neighbors/friends together, so the behavior can be quickly diffuse to other part of the network from one point. The other hypothesis we mentioned in class is that people usually require contact with multiple initial adopters before the behavior get cascaded down. This hypothesis predicts that high clustered network has more unnecessary ties, so it provides social reinforcement for adoption. Therefore, they are better in promoting the behavior across the population. Although these 2 hypotheses are important in the scientific field, it is very hard for scientists to implement an empirical test of these predictions due to the lack of abilities in constructing different social network independently in real life. In 2010, a researcher from university of Pennsylvania conducted a study in exploring the spread of a health behavior under different network structure.
During the study, the researcher, Centola, created an internet-based health community and hired 1528 participants to his experiment. Each participant created an anonymous online profile with a set of health interests. Centola matched each participant with other participants (aka “health buddies”) in the study to construct an online health community. However, there is some rules apply to the artificial online health community in the experiment setting. In order to prevent from interpersonal affect and homophily, participants are not allowed to communicate with other “health buddies” directly, but they could receive emails from the admin in this study to provide update on the most recent status of their “health buddies”. Participants need to make decisions on whether or not to adopt a new health behavior such as registering for an Internet-based health forum based on their “health buddies” choices.
The health forum is a completely new forum created just for this particular study, so no participants have heard it before as such the study can ensure that participants could become the only source of encouragement to other participants in the same study. Participants in this study are divided into a clustered-lattice network and a random network (see the graph below Figure 2). There is a high clustering in the clustered-lattice network. To ensure that each node have the same number of neighbors in both networks, the random network is created from the clustered-lattice network according to the small world model. In other word, in the random network each node has the same number of neighbours as in clustered-lattice network, but the clustering in the random network has been reduced due to the decrement in the number of ties between neighborhoods. In both settings, each participant was randomly assigned to be a single node in the network. The immediate neighbors of each node are the “health buddies” of that node, and the only information the node has is their own “health buddies” that they were connected to.
The researchers ran 6 independent trials and for each trial the researchers allow the process to run for 3 weeks. A random “seed node” is selected as an initiated diffusion. The “seed node” will send signal to its neighbors encouraging them to adopt a health behavior. In this case, a new health behavior is essentially a health forum. For example, when a new person in the network adopt the health forum. The system will send a notification email to all of the friends of this person to encourage them to do the same. In other word, if a participant has multiple “health buddies” adopt the forum, the participant will receive multiple emails. The results of this experiment show that behavioral diffusion is strongly affected by network structure.
The graph below shows the relationship between the time and adoption fraction under 3 different set of data. The research team plot the result from 2 different network structure to the same graph for comparison. We use N denote the population size, and Z denote the number of health buddies each person had. The solid black circle represents the adoption fraction in small world topology network. The open triangles represent the adoption fraction in random network.
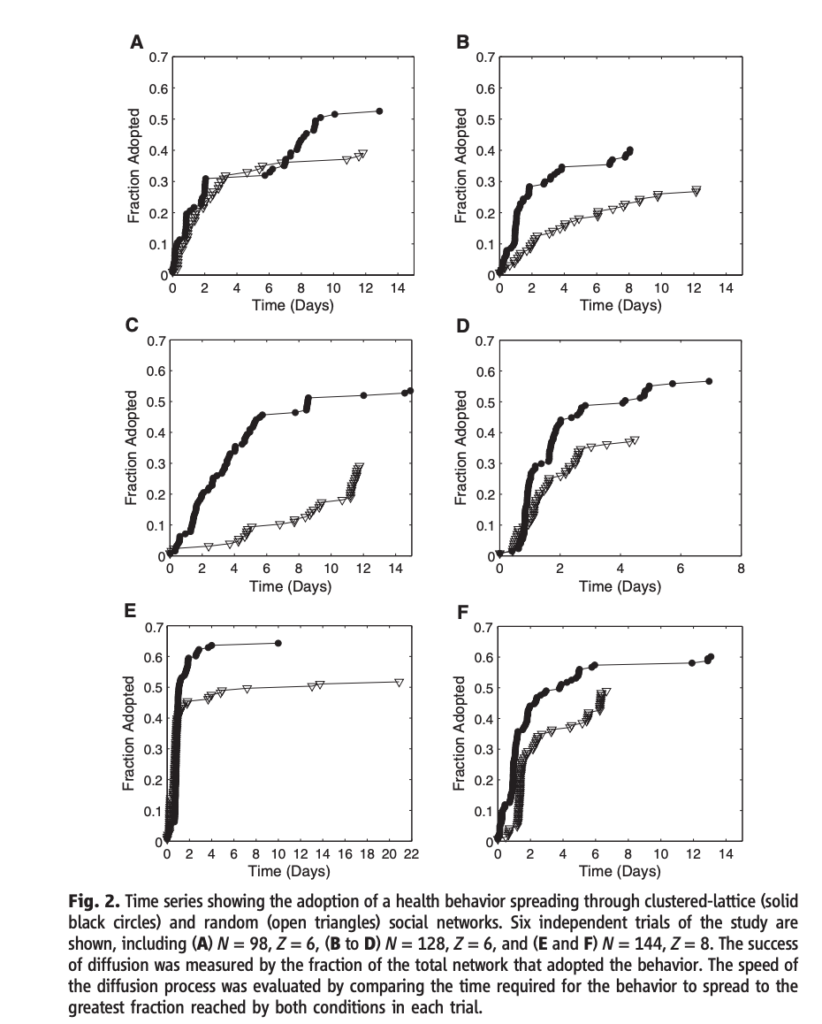
There are 3 interesting findings in this experiment. From the data collected from the research team, the greater clustering and diameter in a network (i.e. small world topology), the more effective it is for spreading behaviors. For example, as we can see from the diagram, the behavior can spread to a greater area quicker in a high clustering network (see the solid black circles) than in the random network (see open triangles).
The second interesting discovery is the more emails an individual received during the experiment, the more likely they will be adopting the same behavior. An individual is more likely to register on the health forum after receiving second email compared to only receiving one email. The third finding is related to the user commitment once they have adopted the new behavior. The data in the research showed that there is more than 30% of participants in the population who signed up after received 2 emails made return, compared to only less than 15% of adopters in the population who signed up after the 1st email made return visit. In addition, 40% of adopters receiving 3 emails made return visits. This finding suggests that the commitment of behaviors from the adopters are greatly affected by the social encouragement and reinforcement.
In conclusion, the small world topology is more effective in spreading behaviours to a larger scale compared to a random network because on average the behavior reached to 53.77% of the nodes in the high clustered network in comparison to only 38.26% in a random network. The results could help the public sector to think about which clustered network they should be targeting first when it comes to public health intervention.
Reference
Centola, D. (2010). The Spread of Behavior in an Online Social Network Experiment. Science. doi: science.1189910