Cooperation in game theory

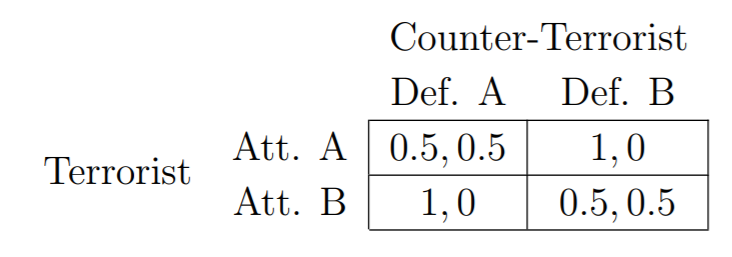
When we are talking about game theory, we assume that everyone is rational. According to the class, we define payoffs as an ‘expected value under persons’ mixture’. To make the payoffs largest, base on the form we have, there are several strategies for every player to decide. However, in reality, it is more complicated than just make decisions base on a matrix.
According to L.Radzvilavicius, “empathy is the secret ingredient that makes cooperation.” Empathy is when people think from others’ perspectives. From the grade example given during class, we can see the importance of empathy (figure1). Even the best choice is when both of the students choosing presentation (each of them get 92). However, if they are both selfish, we can only get 88 for each. The game theory we talked about in class, people are supposed to be selfish in the game. In real life, some human beings are not and maybe they are not working without communication. Back to the grade example, if both of the students choose to be empathy and trust in each other, they will choose presentations and have the best average mark.

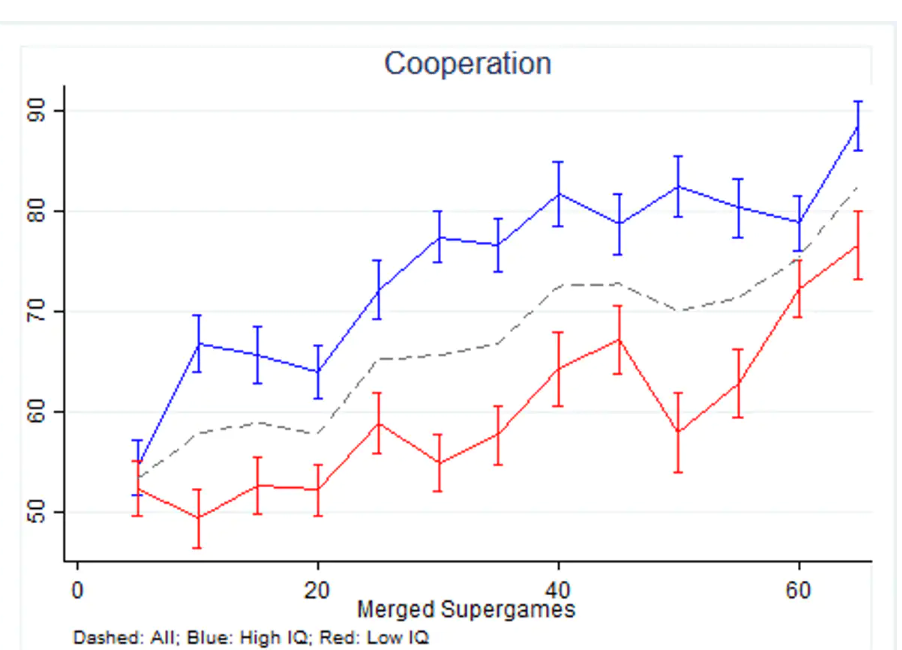
During the class, when we were discussing game theory there were several students asked questions like what if they have some other situations. And I think empathy could be one of the most common situations. According to <How clever people help societies work together better>, the authors argue that high IQ people tend to cooperate and get the best score in the game(figure2). Since high IQ players can usually foresee the maximum average benefit they can get by cooperation. In the experiment, after L.Radzvilavicius make people observe and copy the personality traits of more successful people (be empathy and cooperation), the average score is rising rapidly.

The reality is more complicated. For example, if company A has a stable and reliable cooperation with company B. It is more likely that they will have the best average benefit. Game theory can foresee the game result most of the time. However, there are still more situations to make the result different. The reason for choosing these articles is that they make me realize that there are more things to consider other than just score and one’s benefit in the game. Game theory is more complicated than we thought.

L. Radzvilavicius, A. (2019). Empathy is the secret ingredient that makes cooperation – and civilization – possible. [online] The Conversation. Available at: https://theconversation.com/empathy-is-the-secret-ingredient-that-makes-cooperation-and-civilization-possible-115105 [Accessed 15 Nov. 2019].

Sofianos, A., Rustichini, A. and Proto, E. (2019). How clever people help societies work together better. [online] The Conversation. Available at: https://theconversation.com/how-clever-people-help-societies-work-together-better-93463 [Accessed 15 Nov. 2019].

Instagram: Countering Herd Mentality, Hype and Bots

Recently, Instagram has removed two notable features from its app; the like counter, which displays the total number of likes of any given post, and the following page. This wasn’t due to the GDPR or any security or privacy concerns.
Rather, it is an attempt by Instagram (and Facebook) to counteract the popularity contests that exist all over social media. Consider influencers that hype up products. If they pay enough people to gain traction on their products, they will eventually gain many likes on their posts.

By applying the herd model, if you see that a post has been liked by many of your friends and has a extremely high like count, there is a very high percentage that you would also like this post, even if you are impartial to the actual content. Why? If the post is about something you are not familiar with, you would trust the post because of two factors:

  • a high like count implies this post is trustworthy and many people like the content, so the content must be good
  • friends believe it is also a good post, and you trust your friends
Followers make more honest decisions without social pressure

What Instagram has done partially shuts down herd mentality completely. For one, removing the like count on posts lowers the chances of information cascade because at first glance, it is difficult to tell how many people like and agree with the post (of course, Instagram still shows a list of all users that have liked the content, but it requires additional actions). As the user, you will be more likely to trust your own instinct and make your own decisions on the content of the post without being affected by what others have said (unlike the maj-colour urns) because you cannot see how many people “agree” with the post. Secondly, by removing the following page, it also prevents you from viewing what your friends have liked, which also reduces the chances of information cascade. Herd mentality is stronger when it involves people you know because there is more inherent trust. Lastly, this also counteracts the issue of botting (creating “robot” accounts that don’t follow a typical human’s usage) for likes, because increasing a hidden like counter provides no incentive for promoting a post, unless the content is well-liked.

This trend shows that more social media platforms should follow Instagram’s new model of hiding metrics that may encourage herd mentality so that people can express their true thoughts and feelings without being pressured socially by others. It encourages users to evaluate the information presented and respond appropriately.

Source: https://techcrunch.com/2019/11/14/instagram-private-like-counts/

CS:GO A ‘Short’ Game Theory Analysis

If you’ve ever been interested in any esports, then you most definitely have come across ‘Counter Strike: Global Offensive’ (CS:GO). CS:GO is a very popular first-person shooter, released in 2011 to replace it’s predecessor ‘Counter Strike Source’, with just under 1 million concurrent players worldwide. There are multinational tournaments held with over $8.6 million in prize money released this year.

With well over 500 competitive teams all over the world, there are many people that make a living off of this esport. Now the question boils down to: what makes a team such as ‘Astralis’, currently the number one ranked team in the world, so successful in what they do? We will be taking a short glance into what a game analyst would need to look at to help teams make quick split second decisions to ensure that they have the best possible outcome for their team.

Counter Strike: Global Offensive cover art
Counter Strike: Global Offensive Cover Art

I will first give a quick rundown of how the game works. Two teams of 5 in-game players each face off for 30 rounds – or more if they tie at 15-15 – where each round lasts 1 minute and 55 seconds. In the first round, each player is awarded $800 to buy armor/utility grenades/weapons to help them win the round. Upon each kill, and outcome of the round, each player is awarded money to use for the following round. The two teams are split as Terrorists and Counter-Terrorists where the objective of the Counter-Terrorists is to hold and defend a ‘site’ – 2 per map – and the objective for Terrorists is to plant a bomb at a ‘site’ and ensure that it goes off before the round ends.

We will try to see what a game analyst would have to consider when doing their job. We will consider a key moment in the game: defending a site, and attacking a site. To make things simple, we will consider this game as having two players – Terrorists and Counter-Terrorists – and we will assign payouts similarly to a zero-sum game where players are awarded a sum of 1, representing their chances of winning the round. One thing to note is that there are many choices that a team can make – too many to really organize in a neat fashion. Such decisions go down to what equipment is bought/caried over from the previous round to a single footstep that is made in the game. The number one thing the game revolves around is information. Whichever team has the most information as to the other team’s status has control of the round.

Very basic payout matrix example

The payout matrix seen above is an extremely rudamentary payout matrix of what a game analyst may build to help teams decide on what kind of strategy is the best strategy for them at any round. Now, in order to make this payout matrix more accurate a game analyst would have to tailor it to specific teams, as each player has an individual skill level. The ‘decisions’ are also not as simple as ‘Attack A’ or ‘Defend B’. There are many decisions that are made by each player in each round that may have an effect into rounds that follow. Each of these decisions would change your expected payout for the end of the round. Being able to identify the outcome of each decision that a player makes, and which further decisions will lead to the best outcome can determine the round. Now a players decision can also be because of some information that they have recieved of a decision from the other team within a round. This should also incoporated to ensure nothing is missed.

The purpose of this was to show how what we’re learning can be taken and applied to the real world and how professional gaming teams would nead data such as this to give them a better advantage over their opponents. Albeit, my example was extremely oversimplified against what a real payout matrix for a round would look like, I hope that my explanation showed how complex such payout matrices can get within the professional world, and more generally, just how such matrices are used professionaly.

Bibliography

Gaming the PageRank System

Having your website ranked high on search engines is a huge advantage to anyone. You or your company’s name would become more well-known, more traffic would be driven to your website, and then ultimately, you would benefit through increased sales or positive exposure.

These are a few of the many reasons why someone would want to increase the PageRank for their website, which is a concept we have discussed intensively in class. One strategy to artificially inflate PageRank is to participate in a Spam Farm, which is also what we’ve seen in one of our assignments. As it turns out, Google disallows this setup—called a “link scheme”—in a document of theirs called “Webmaster Guidelines”.

“Webmasters who spend their energies upholding the spirit of the basic principles will provide a much better user experience and subsequently enjoy better ranking than those who spend their time looking for loopholes they can exploit.”

– Google’s Webmaster Guidelines

It obviously makes sense to disallow link schemes—otherwise, the Internet would be full of pages of websites that links to many other websites, which is clearly not helpful as an end-user who wants to search for actual content. Google makes sure that this doesn’t happen by detecting websites that participate in these link schemes and consequently removing them from search engines, effectively discouraging others in following suit.

However, it is still possible to be given penalties and be removed from search engines even if you follow all the rules in their “Webmaster Guidelines”.

Despite not having built a single link in years, Dan Petrovic still received a warning from Google about “buying links that pass PageRank or participating in link schemes” and had his website removed from search engines for unclear reasons. On a separate but related note, John Mueller from Google even says that you are responsible for the content on your own website, even if it has been hacked or changed, illegally or without your knowledge.

Though this doesn’t happen too often, having your pages removed from search engines can be incredibly frustrating for website owners—to the point that instead of gaming the system to increase your PageRank, you might instead try to be careful with the content and links on your website so as to not incur Google’s wrath.


References:

Retrospective of Power Laws in Modern Industries

Modern industries in a Catch 22?

There is an opinion among some of us that the workplace is getting increasingly difficult to get into. “In order to get experience you need a job, but in order to get a job you need experience” In some cases that is true but has highlighted the need for evidence to show skill to break into a market. Is there a correlation then between current powerhouses in particular industries to those who want to start? One person was up to the task and scraped the web to compile the results of many industries into analyzable data.

Remember that Power Laws can indicate a behaviour effect known as “rich get richer”. Those who already have the money and resources will profit much more over their efforts, a positive feedback loop for them. If we look in the case of Video Games, or any form of entertainment media or the people involved, this is immediately apparent. Those that are current established have the capital, the resources to utilize in order to produce content that has a higher likelihood of producing more of it, the experienced gained from doing so helping fuel the next so (in a perfect setting) they can keep propagating themselves forward. This is also apparent for individuals, such as Movie Directors, where very few make lots in the Box Office whereas there are many unknown directors that make little comparatively. Of course this is the case because some may be indie directors, still students and such but there is a big underlying influence upon this. Experience and evidence and in my opinion, market maturity.

A big reason this positive feedback loop exists may be because of the fact that these industries are now so big, that those established are the ones making the decisions or hold some form of influence. Movie studios are more likely to invest in directors who already have a name to them because they have seen that they managed to produce movies with huge Box Office returns. Game companies manage to produce huge games that are potentially popular and profit hugely because they had the financial resources to do so. The reason they got the resources to do so is because they have the evidence they can do it from past experience that gives the evidence of their capabilities. But like any industry, I believe this is only the result based on market maturity.

Suppose that you are pioneering in an unheard market or industry, and you are one of the few that managed to produce something in this market that is now widely consumed or utilized. Because of this, years down the line, you are now the CEO of a corporation due to the efforts of your work. Compare that to modern day where a person who wants to make a start up for an already established industry. This is what I consider market maturity in a rich get richer setting. Most but not all of these industries managed to become so big and develop a name for them because of the infancy of said industry. When something starts, it doesn’t necessarily have the experience to indicate the competency, only that they have the qualifications. Suppose there is now a new web browser to use, but who would use it over established companies and theirs like Google Chrome or Mozilla Firefox. In many cases, it doesn’t matter if you can do it, it matters if you can show evidence of it.

You can even see this in nature. A study analyzed the positive feedback loop of the growth of a forest and the disparate heights of trees. They found that trees that were already taller than the others, and thus managing to absorb more of the sunlight thrive much better than those stuck under them. It could be because they were older and thus taller, and because of that, managed to take more of the limited resources compared to new comers, as they have already established themselves as the powerhouses of growing. This highlights a key concept discussed about how this concentration of success happens.

Returning to the fact, it seems like because of power laws existing in the industry, getting jobs may be harder for new graduates. Of course Co-op programs and Internships exist to help mitigate that problem. But in a society where established industries with established entities are asking more, it seems new individuals have a higher chance of getting drowned out because attention is drawn more towards those established. Some candidate hires for a company may be neglected because they don’t show as much promise and proof compared to those that have much more. It leaves much to discuss how more disparate this will be as time passes.

References

The Power of Words

Most people don’t create language on purpose. We learn it, from our parents, our peers, nowadays from the internet. In addition, when we use language, whether spoken or in writing, we don’t consciously distribute words according to some statistical model. So why do natural languages such as English follow a power law distribution so closely?

Zipf’s Law is a model used to describe empirical data that states that the number of the occurrences of an event is inversely proportional to its popularity. That is, if an element’s frequency has frequency rank r, we have some constant factor C and exponent alpha such that

If we arrange English words found in texts by order of their popularity, for example, at the beginning of the list, we get the, be, a, and, of, etc, these words will closely follow this distribution. According to Li, we have C approximately 0.1 and alpha approximately 1. That is, the most common word occurs 1/10th of the time, the next most common word occurs 1/20th of the time, etc. This is follow more closely by more common words since they are guaranteed to be more frequent. While we would expect some distribution where where the words with the highest frequency rank have the most occurrences, why this would follow a power law is not obvious.

Zipf proposed that humans follow the principle of least effort, that is, speakers of a language will put in only as much work as necessary to convey intention through talking. This isn’t done on purpose, but as a result, there is an equal distribution of effort where more general words are used much more often. However, this doesn’t completely explain the phenomenon.

photograph by Tjo3ya, distributed under CC BY-SA 3.0

We can consider the network structure of this problem. Like many human processes, language can be modeled using graphs. In particular, parse trees can describe not only the structure of sentences, but how humans think about creating those sentences. Again, while not deliberately done by people, people structure their thinking in terms of phrases such as noun phrases, verb phrases, etc. The most common words are used throughout these different types of phrases. Thus, we can expect to see frequency rank and number of occurrences follow some sort of log-log structure, such as in Zipf’s law and therefore a power law distribution.

References

Adamic, Lada A. “Zipf, Power-Laws, and Pareto – a Ranking Tutorial.” Zipf, Power-Law, Pareto – a Ranking Tutorial, Information Dynamics Lab, HP Labs, www.hpl.hp.com/research/idl/papers/ranking/ranking.html.

Li, W. “Random Texts Exhibit Zipf’s-Law-like Word Frequency Distribution.” IEEE Transactions on Information Theory, vol. 38, no. 6, 1992, pp. 1842–1845., doi:10.1109/18.165464.

Wyllys , Ronald E. “Empirical and Theoretical Bases of Zipf’s Law .” Library Trends, 1981, pp. 53–64., doi:10.1.1.562.5217.

Zipf, Human Behavior and the Principle of Least Effort

Power Laws in the Stock Market

Reference journals:
https://pubs.aeaweb.org/doi/pdf/10.1257/jep.30.1.185
https://www.sas.upenn.edu/~fdiebold/papers/paper39/ABDE.pdf

For purposes of maximizing profits and minimizing risk in stock markets, many traders seek to model the stock market as accurately as possible. Recently (<100 yrs), index investment has grown in popularity over investments in individual stocks (index investment is a strategy of investing in a broad market or range of stocks). The reason can be explained using power laws.

In almost every major market benchmark such as the S&P500, the top 20% of stocks, in terms of market cap and trade volume, represent approximately 85% of the total market size. More interestingly the same pattern appears in the distribution of market returns. The top 20% of stocks represent approximately 80% of the market’s year-on-year return (on average). This inequality is graphically similar to the long-tailed graphs we saw in class; in other words, the distribution of returns in the stock market is a long-tailed power law distribution. And according to the author’s research, it is in fact consistent with

P(x > X) ~ 1/X^a , with a = 3 : an inverse cubic power law

This formula is consistent with the one we discussed in class: p(x) = x^-a. It is also consistent with our discussion of the value of alpha (the a value) which we discussed to mostly be 2 < a < 3 . This is interesting but why is it important? This is important because since stock markets follow power law distributions instead of something like a Gaussian, extreme variations in day-to-day prices (such as crashes) are very rare. Because of the cubic law behavior of markets the chances of a stock price deviating from the mean by 10% is 1000 times less than if market returns were instead Gaussian. And we can see this in practice, on average only 1 out of 1000 stocks on any given day on the NYSE deviate by 10% (which means the market is relatively stable, which is good).

This modelling of power laws is also leads to strategies for trading. Traders can either aim to pick or not pick the stocks that tend to deviate more. In a good economy, perhaps they will pick the few stocks that are on the extreme tail of the power law distribution, and oppositely in a bad economy. Example being in 2015 when the S&P500 would have ended the year with negative growth if it were not for 10 stocks and F.A.N.G (FANG = Facebook, Apple, Netflix, Google). Conversely, during the tech bubble burst, you would not have wanted to pick these stocks. In class we briefly discussed models that lead to power laws. It turns out that the random walk model is what makes stock returns a power law distribution.

Any blue bar above the 0.0% line means that for that year, the top 10 stocks in terms of growth out-contributed the rest of the 490 stocks combined (S&P500). Note in years like 2015 and 2000, without the top 10 stocks, the market would have experienced negative growth. This extremity in contribution represents in bar graph form the power law distribution of stock market returns.

Going back to why index investment is gaining popularity — because according to the distribution of market returns, it is safer to diversify instead of pinpoint specific stocks. Investing in stocks from the tail (extreme deviations) only works when times are good, and because it is very difficult to predict good/bad times, money managers often make the safe play of diversifying (game theory!).

Overall it is interesting to see how the theory of power laws we covered in class are represented in society because sometimes it is not immediately obvious as to why power laws would model certain things — such as the stock market since for the most part the market grows and shrinks randomly.

Reference List

Gabaix, Xavier. “Power laws in economics: An introduction.” Journal of Economic Perspectives 30.1 (2016): 185-206.

Andersen, Torben G., et al. “The distribution of realized stock return volatility.” Journal of financial economics 61.1 (2001): 43-76.

Game Theory Can Explain Cooperation In Nature

The vervet monkey, upon encountering a predator, will scream to warn it’s neighbors that danger is nearby, at the cost of attracting more dangerous attention to itself. At first glance, it would seem that natural selection should have wiped out the screaming monkeys from the gene pool. After all, If the monkey remains silent and concentrates on getting itself to safety, it lives on and can spread it’s genes, which it cannot do if it is mauled by the predator. The opposite is the case however, and these monkeys cooperate and work together to survive, why?

Vampire bats also act in a way that at first seems counter-intuitive: the bat can share some of its food with members that were unsuccessful in finding any. This can be modeled in a similar way as the prisoner’s dilemma:

Both bats have a dominant strategy to not share, and yet it has been observed that they do share.

While it makes sense to not warn other members of the species or not share food playing a single game, when you play the same game multiple times the dominant strategy can change.

In the 1970’s, Robert Axelrod, a political scientist, held a tournament which consisted of a fixed number N iterations of the prisoner’s dilemma. Contestants would submit their algorithm that would be a “player”, and at each step the algorithm could only make 1 of 2 choices. The algorithm would have access to previous moves made (a memory), and the goal is to get the highest payoff. The format of the tournament was round-robin, so every player played against each other. The winning algorithm was the simplest one, called tit-for-tat, which consisted of mimicking whatever the opponent did on the previous step. This means that if the opponent decides to be greedy, on the next iteration the player would also be greedy, and if the opponent cooperates, then on the next iteration the player cooperates too. This was the best strategy to ensure the largest payoff.

Perhaps now it is not so difficult to see why members of some species choose to cooperate. If each animal considers each game as a single instance, then they will always choose the greedy approach and end up with a smaller overall payoff. However, by remembering and copying what the others do, cooperation is followed with more cooperation, and the entire species enjoys a higher payoff.

https://www.quantamagazine.org/game-theory-explains-how-cooperation-evolved-20150212/

Braess’ Paradox & Basketball

In the 1999 NBA playoffs, Patrick Ewing, who was a star player that played for the Knicks tore an achilles tendon during the second game of the Eastern finals against Indiana. Despite the unfortunate timing of the event, the Knicks went on to win the next set of games and made it to the finals for the second time in 26 years. How did this happen? Did the Knicks just get lucky? This was the origin of the concept known as “Ewing theory.”

It turns out that many other teams have also had such experiences and it isn’t just limited to basketball. The common observation across such examples is that a team sometimes performs better without their key player. It is a counter intuitive result that is very similar to a topic that we learned in this course, the Braess’ Paradox. The example we studied in class was the fact that sometimes closing major roads helped improve traffic congestion in the area. Is the same phenomenon occurring in Basketball? If so, how can we analyze it?

The paper titled “The Price of Anarchy in Basketball” by Brian Skinner who is a postdoc at MIT, suggests a potential way of studying Basketball offence strategy in a similar manner in which we studied Traffic routing as a game. In the traffic problem, we need to route cars from a source to a destination. In this case, we would try to find an efficient route from initial possession of the ball until a shot is taken. This is shown in the figure below. 

The players are the cars and the routes they can take are different plays that they can make and the goal to reach is travelling towards the basket. Finally, the payoff in this model is to maximize the efficiency of the shot.  The efficiency of a shot can be thought of as the probability that a shot into the basket is successful. To simplify this problem, the efficiency of the shot is only dependent on who is taking the shot. Another key assumption made in this model is that the more the percentage of shots taken by a single player in a game results in decreasing efficiency which is analogous to more cars on one particular road increasing the congestion of that path. To measure initial efficiency, in this paper, they make use of a well known statistic used in the NBA known as the true shooting percentage, TS% as a measure of the probability of a shot going in depending on which player takes it. 

Consider the model below that shows a concrete example of how we can analyze the offensive strategy for a team. 

While the paper goes into much more detail on this example, the high level idea can be summarized as follows. Each edge in this network represents the payoff of a decision. The decisions are in this case for player 1 to drive to the net or pass to player 5. The decisions for player 2 are to also drive to the net or pass to player 5. Although this example is different from the traffic routing where every player acted in their best interest to minimize their travel time while here the players are all a part of the same team, there is a different notion of best interest here. The payoffs on the edges represent what each player alone might think is the best decision so we assume that the players act according to their own logic. Furthermore, player 5 in this example can be thought of as a key player in this team. Also, consider the similar model as figure 5 below that has player 5 removed.

Using concepts of Nash equilibrium, the paper computes an overall efficiency at equilibrium of 0.33 while removing the player results in a new equilibrium of 0.375 which is higher than the previous. Player 1 and player 2 now do not have the option to pass to player 5 which limits their choices. This situation is analogous to the improved congestion in traffic when a main node was removed; the Braess’ paradox.

While the model used for analyzing basketball strategy is oversimplified here, as the author of the paper also agrees, it is a good starting point. It also provides some intuition for the improved performance of a sports team when a key player does not play.

Reference List

  1. Simmons, B. (2001, May 9). Ewing Theory 101. Retrieved from https://www.espn.com/espn/page2/story?page=simmons/010509a.
  2. Skinner, B. (2010). The price of anarchy in basketball. Journal of Quantitative Analysis in Sports, 6(1).

Blockchain and Cryptocurrency Game Theory

A block is a sequence of blocks in which individual transactions are stored. That block also includes the previous block’s hash, which in effect binds that subsequent block to the previous block creating a chain. Hence the word “blockchain” is a rough visual representation of a blockchain.

Rough visual representation of a blockchain

There are two players in a Bitcoin blockchain-based system: Users, Miners

Users: Users have only two roles at their fingertips in Bitcoin: send coins or get the coins. They need two keys to do that, the public key, and the private key.

Miners: What miners are doing is authenticating the transactions and doing the mining process. Mining is how to discover new blocks and add them to the blockchain. Miners have a lot of power in the blockchain system and they can cause havoc in the process if they choose to cheat for their own personal gain. They can cheat in several ways. For example, they can include an incorrect fee and provide extra coins for themselves. Additionally, they can add blocks randomly without thinking about proof of work. To get more BTC, mine on top of invalid frames. Mine on top of a block that performs sub-optimally.

Example of “double investment”

The key chain is blue frames. Now imagine there is a miner who invests 20 bitcoins (hypothetically) in blue block 51 to get 500 litecoins (a different cryptocurrency because of a different parent block). And now, with a new block 51 (red), he wants to create a parallel chain where he never made this transaction. So, let’s make a quick recap to simplify what he’s just done: 1. In blue block 51 spends 20 bitcoins to get 500 litecoins. 2. Creates a new chain (fork) from block 50 and in the alternate block 51, he doesn’t do the litecoin transaction. 3. In the end, he comes out with his original 20 BTC and 500 new litecoins. What has just happened here is called “double investment“. Theoretically, miners can now mine on top of the new red chain and continue double-spending and extra bitcoins mining. As you can imagine, the bitcoin network can be broken in this case!

To counter this, the blockchain uses concepts from game theory to maintain the bulletproof system. It was designed in a way that it is a self-enforcing Nash Equilibrium.

The Nash Equilibrium in mining and the punishment system (Miner)

If a miner produces an invalid block, then due to a rule that has been established in blockchain mechanics, others will not mine on top of it. Any block mined on top of an invalid block becomes a block that is invalid. Using this rule, miners simply ignore the invalid block and keep the blue chain in the diagram on the top of the main chain. A similar logic stands for block scoring sub-optimally. Check again at the diagram. No miner on Red Block 52 will want to mine as the Blue Block 53 is going to have a higher score than the red block.

Both of these situations are mitigated as miners choose the most stable state or with a Nash Equilibrium as a group. Clearly, all the miners can mine on the red block and make it the new blockchain, but the number of miners is so large that it’s simply impossible to organize an activity like that. According to the Diffusion of Decisions, if a majority of the group’s citizens do not switch their state, the minority will have no incentive to stay in the new state. (For most of the cryptocurrency, q is near 1) Seeing this, a miner is less likely to spend all their computing power and risk ostracising in a futile cause.

Why users prefer the main chain than the other chain?

The first thing that we need to keep in mind is that cryptocurrency has value is because the people give it value. So why is a normal user going to assign value to coins that come out of the blue chain and not to coins that come out of the red chain? The explanation is clear. From the users’ point of view, the main chain is a schelling point (It is a solution that, in the absence of interaction, people will continue to use because it feels unique, meaningful or natural).

Diffusion of Decisions: Another reason consumers are more interested in the main chain is that they are actually used to it. Unlike bounded claims of rationality, each time people choose the simplest solution. Going through a new chain complicates things unnecessarily.

From this example, we can see that game theory makes blockchains so different. There is nothing new about the mechanics, but the combination of Nash Equilibrium and Diffusion of Decisions has made cryptocurrency free from internal corruption. Even if Bitcoin collapse recently for whatever reason, because of this path-breaking relationship, cryptocurrency will always live on.

Reference:

1. Cryptocurrency. (2019, November 11). Retrieved from https://en.wikipedia.org/wiki/Cryptocurrency.

2. Rosic, A., Rosic, A., Pontoriero, L. E., Dosunmu, O., Derosa, F., Warraich, J. A., & Marinkovic, M. (2019, October 3). What is Cryptocurrency Game Theory: A Basic introduction. Retrieved from https://blockgeeks.com/guides/cryptocurrency-game-theory/.

3. Digital Currency, Bitcoin and Cryptocurrency. (2018). Inclusive FinTech, 33–82. doi: 10.1142/9789813238640_0002