Suppose you want to send a file over to your friend, it has to undergo many layers of the internet. In the transport layer, files are first fragmented into small packets, which are the small data units that gets transferred over the network. Network routers play an important role across the internet, because they are the traffic control devices that ensures packets are safely and efficiently delivered to the destination specified by IP headers. Border Gateway Protocol(BGP), is a protocol between routers that updates traffic information about the network, the most important thing it does is that it finds the shortest path for the destination IP address.
The whole Routing System is a decentralized network
Each rounter and IP address represent a node and its location respectively.
Packets are the messages get transferred from Node s to Node t.
Source routers only know other routers’ IP address in its IP address cache.
For a file transfer from source router <s> to destination router < t>, the source router is given a file and the destination IP address to send to. Initially, the source router only knows the routers that are cached in its IP address table, it then messages to all the IP address on, which in turn should have messaged to all the IP address they know, essentially it conducts a breadth first search. Source router then transfers the file over to the router that claims to have the shortest path.
Route Hijacking
24th of April,2018, Los Angeles, Seattle and Detroit in the US were able to connect to Amazon’s DNS server. These regions connected to a network prefix 205.251.193.0/24 (Amazon’s announced proper prefix is 205.251.193.0/23)shows up mysteriously. This is a route hijack, a malicious intent took control of a network and advertise a fake shortest route to Amazon. During the hijack, This allows the hacker to redirect traffic to other places than where it was supposed be directed to, namely Amazon.
Even the network routing system is designed efficiently for network traffic. The system is intended for a trustworthy environment where every routers play according to the rule. However, It is very vulnerable to malicious attacks.
Video games has seen an exponential rise in popularity and investment over the last few decades. What began as an experiment to bring interaction to a computer screen has lead to a billion dollar industry worldwide. In response, many companies have popped up or joined the industry to make games for gamers to enjoy, with the effect of creating communities centered around specific game console platforms. The term “console wars” is rooted since around the start of the millenium, and refers to the fact that in recent years, the gaming industry is segregated into communities of players who stick to a particular console. However Google is aiming to break that apart. Google Stadia is an effort redefine these communities as rather than dense clusters bridged together by players that operate on more than one console or specific games offering crossplay, to a routing of players to a more small-world community.
Google Stadia is a service, that takes a gaming console, hardware medium to play video games on, and puts it on the cloud. One can simply use a Chrome browser or the Chromecast service that Google offers. According to Phil Harrison, Vice-CEO of the company, stated that gamers could expect to play games regardless of console platform as well have the ability to have crossplay. Crossplay refers to a player playing with other people for a particular game, where they may not necessarily be both using the same console.
An idea essentially is formed about how the networks are formed. The major three companies, Microsoft, Sony and Nintendo have a big community of gamers that play games from them, forming big clusters. Unless a game offered crossplay or if a player owned more than one console, these communities were highly centered to whatever platform of choice. There is a rivalry going on between all three, forming a negatively balanced relation for a majority of the video gaming history.
Google Stadia aims to bridge that gap. Similarly to how in the building of small-world models, especially Kleinberg’s model, discussed in class, Stadia aims to provide a convenient path for players to connect via a new platform that doesn’t require one to choose a side and no matter how rooted into the current communities they are. This however is still all hypothetical. It remains to be seen if one service can finally bridge the dissenting split of players.
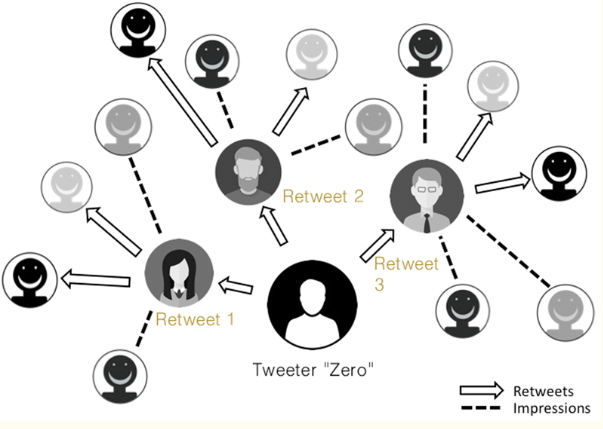
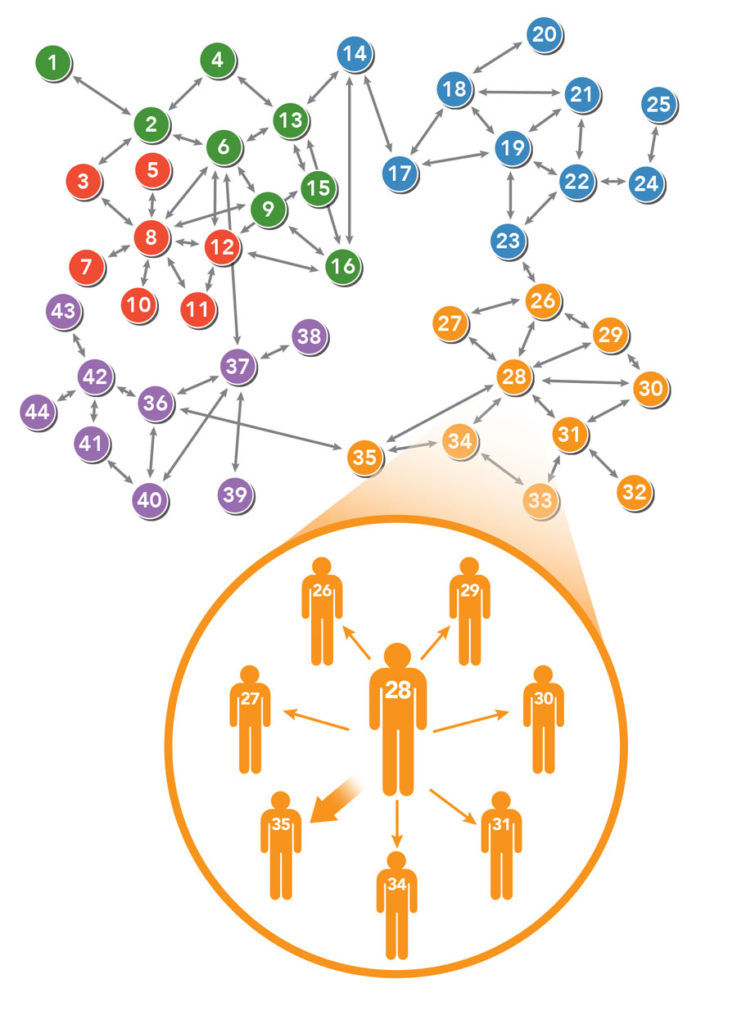
Nowadays, the internet is helping information to flow more extended and actively. Let’s take journalism as an example. Back to 20 years ago, if there was breaking news, people usually could not get announced until it is reported on tv or newspaper. However, by using mobile phones now, people can receive messages at any time anywhere. According to Thomas and Varghese, they give an example of how the tweet is expressed through these people(figure 1). This reminds me of the 6-degrees we discussed in class. Tweets are only spread in one-way, and also, people can retweet even they are not friends. Therefore, the information can be spread wider and wider. The report suggests that the number of people who can see the information is growing exponentially. Especially, if one of the reposters is a high-profile people, then the tweet will spread way faster than usual. This is the effects of target’s characteristics.
Several factors will enhance the spread of information on social media. First off, the power of social norms; secondly, “having a clear moral incentive to act”; thirdly, the feeling of compassionate; fourthly, turning the social pressures into personal behaviour. These make people feel a sense of belonging, and more likely to engage in the event. People think they are having the same behaviour as others in society. However, this is causing problems. Users are more likely to get participate rather than doing the right thing. According to (2015). Weibo and Wechat are becoming the main method of Chinese receiving information. The report suggests that about sixty percent of the fake news comes from Weibo. Because of the lack of self-correcting ability, most people cannot judge the validity of the information. Then rumours become widely-known and hard to refute. So, fast-spreading from social media can also cause big problems.
We can see that social media is changing people’s daily lives. It allows people to have faster access to information. However, at the same time, the sources could be invalid. People now should have the ability to judge the correctness of information rather than just “follow and retweet”.
Xiao, E. (2019). 60 percent of fake news come from Weibo. [online] BBC News. Available at: https://www.bbc.com/zhongwen/simp/china/2015/06/150624_china_new_media_report [Accessed 11 Oct. 2019].
Varghese T. K., Jr (2017). How Does Information Spread on Social Media Lead to Effective Change?. Clinics in colon and rectal surgery, 30(4), 240–243. doi:10.1055/s-0037-1604251
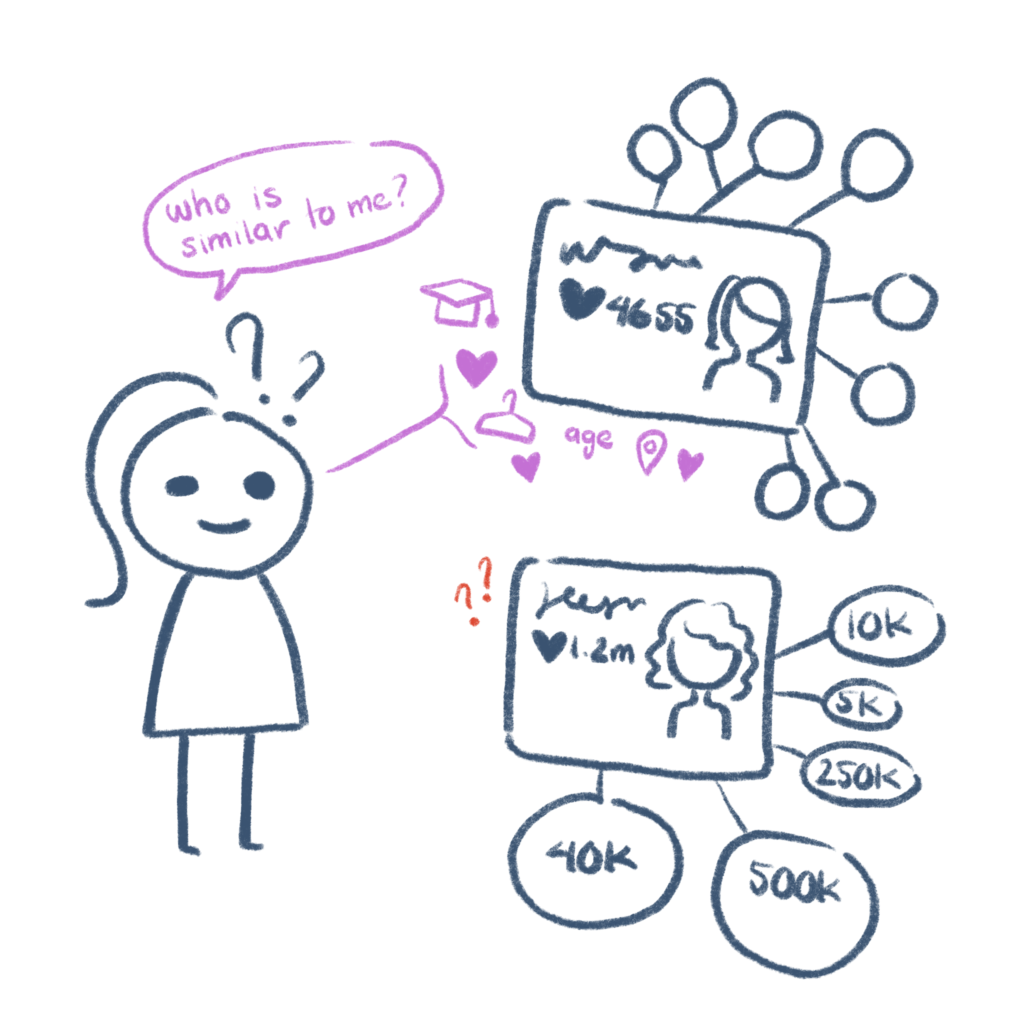
Nowadays, a lot of consumers use Instagram as a source of style inspiration. This has been a wonderful thing for brand marketers — instead of worrying about the logistics of creating a marketing campaign, hiring models, creating sets, and preparing shoots — all of that work can be delegated to social media influencers. Now comes the question — as a brand, how should we choose the right influencer for our marketing campaign? How do we ensure that we get the engagement that we want? Should we choose macro-influencers — those with a large following, or perhaps those that are lesser-known? What is the most important factor that determines how effective an influencer is when engaging an audience? Homophily.
One study aimed to find out the reasons for which different followers liked certain influencers. Do people follow influencers because they are attractive? Well, only somewhat. Attractive posts catch the eye. However, it was not the main reason. When asked about why they followed their favourite influencer, many participants said that the influencer led a lifestyle that they wanted for themselves, or they shared similar interests with them. The influencer has to be relatable. In this way, Instagram acts as a mirror for followers. Influencers are often living the life that their followers want. One of the participants, Martha, said that both of her parents were doctors and wanted her to pursue medical school instead of fashion-related subjects. One of Martha’s favourite influencers is Eva Chen. She similarly left medical school to work for a fashion magazine. Perhaps Martha felt that Eva would understand her circumstances, and is now someone she aspires to be. Birds of a feather indeed flock together. On Instagram, the influencer model follows the concept of homophily. Followers prefer to like influencers that they share common interests with. Not only will he/she be able to see more content that they like — but through the influencer, he/she is exposed to that influencer’s follower-base.
If you thought that choosing the macro-influencer (with more followers) over the micro-influencer would yield more engagement, think again! One study also found there was trust for micro-influencers as compared to macro-influencers. Homophily explains this as well. When an influencer has a large following, they usually have to cater to a larger range of interests held by their followers. They may be viewed more like a celebrity to be admired from afar — which decreases the influencer’s similarity. On the other hand, a micro-influencer might have a following that shares similar interests with each other. Pleasing “everybody” is not an issue.
The main takeaway is that homophily (not necessarily popularity!) is what drives engagement and credibility on Instagram. One may think that someone would be more likely to show affinity with a more popular influencer. But instead, it is homophily — how similar a follower perceives the influencer is to them.
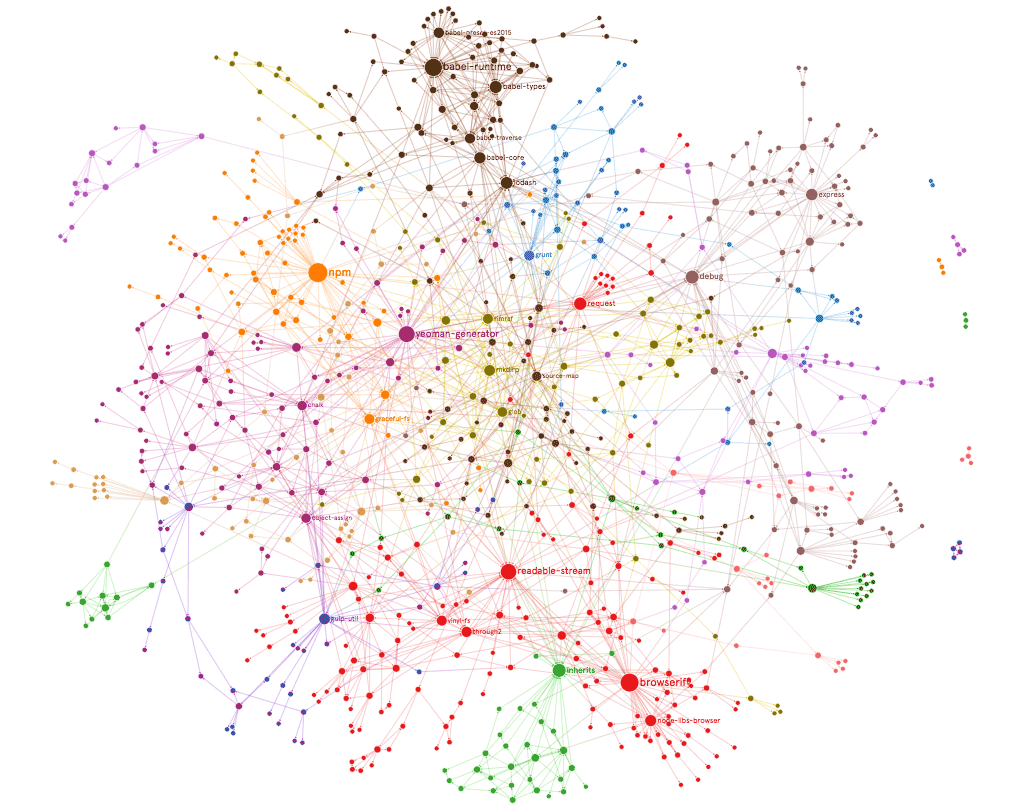
Nowadays, web apps are extremely complex and are often comparable to native applications. Yet in the Javascript ecosystem, these apps are dependent on various modules that serve as a small cog in the wheel of the app and these modules live on the repository known as npm. Over time, developers become dependent on these modules (sometimes regardless of simplicity) to address issues or features in the application, which results in an application’s codebase with a dependency graph similar to the following:
Large, entreprise applications may have hundreds if not thousands of dependencies and it only takes one to break to bring the application down. In fact, a similar scenario happened recently with the infamous left-pad module, bringing down Node and Babel.
npm creates a single point of failure that makes it extremely susceptible to attacks/failures The npm repository of JavaScript modules creates a single point of failure for most, if not all JavaScript-based applications in the world. Why is this so? Whenever a module (let’s call this A) is used as a dependency for a web app X, this creates a directed edge from A to X. However, modules can also use other modules as dependency, so another module B may also have A as a dependency, creating another directed edge from A to B. Therefore, a web app Y may not directly depend on module A, but if it utilizes module B and module A is removed or changed maliciously, Y will encounter failures (at the build step or even during runtime) or be susceptible to the malicious attack. To determine these modules, we consider them as nodes in a graph and find the nodes that act as bridges, which can be done by looking for nodes with the highest betweenness.
Developers should make it a goal to minimize the applications dependencies to retain greater control of application stability and security Over time, a popular library that includes various modules may become extremely fragile since only one of its modules failing would break the entire library. This is why developers should minimize the use of modules, especially for simple functions. For example, writing a small wrapper for native ES6 Fetch API should be preferred over Axios (~6 dependencies) because it is a simple function that should not require many dependencies.
In extreme cases, dependencies can be updated and injected with malicious code without developers from knowing, then every application that uses the module is affected, which causes another cascading effect. One example of this is the event-stream module that started to steal cryptocurrencies’ private keys to wallets. One way to prevent this from happening is to verify packages using some sort of hash to guarantee a package’s validity. Otherwise, we have to hope that bad code doesn’t leak into these modules.
How is it possible that something seemingly unpopular blows up all of a sudden and becomes a trend overnight?
What if it actually hasn’t become a trend, and you’re the only one who perceived it to be that way?
This phenomenon is known as the “majority illusion”—a paradox where you conceive a certain attribute as being popular just because most of the people around you have adopted it when, globally, that certain attribute is actually uncommon.
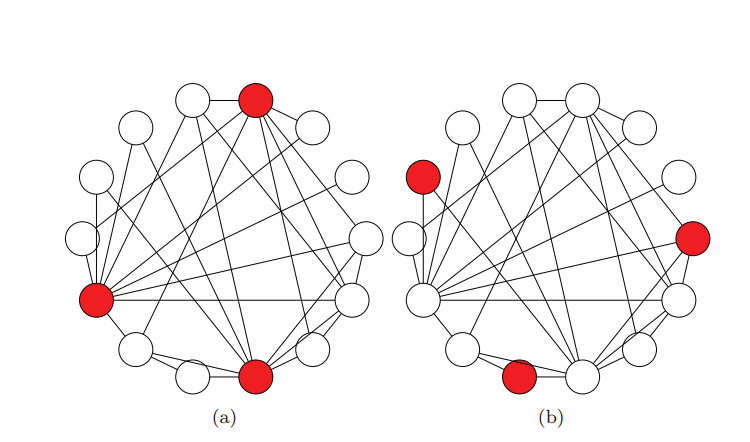
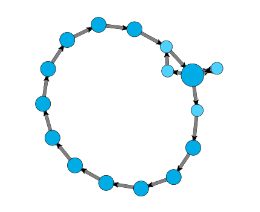
As an example, we have the figure below.
The graphs (a) and (b) form the same small world network, as discussed in class, of 14 nodes and 3 coloured ones, with the only difference between them being which nodes are coloured. In graph (a), the uncoloured nodes see that at least half of their neighbours are coloured. This, however, is not true for any of the nodes in graph (b). If we now define nodes as individuals and a coloured node as a person with a shared attribute, we can see that the “majority illusion” would only apply to the uncoloured nodes on graph (a) and not graph (b).
What makes the “majority illusion” fascinating is that only 20% of the individuals in graph (a) have a shared attribute, yet the remaining 80% would still believe the attribute is popular just because at least half of those who they are connected with have it.
The “majority illusion” does not occur in just any regular social network though. The most important aspect, as Lerman’s article states, is that the network is disassortative. In other words, the “majority illusion” is stronger in graphs where nodes of low degree are more likely to connect with nodes of high degree, and these nodes with high degree have a shared attribute, as observed in graph (a).
Perhaps it is obvious that individuals who have high degrees of edges are more influential, or that those who have low degrees of edges are more easily influenced since their circle is smaller. This, however, can be difficult to realise when you yourself are part of the network. Just like the decentralized search seen in class, we only know of the individuals adjacent to us, and do not have complete knowledge of the network.
Something we can learn from the “majority illusion” paradox is that the next time we see something becoming popular, maybe we should take a step back to check if that really is the case before we get influenced or begin to accept it as the norm. It might even be to all of our benefit to connect with more people in order to gain a wider perspective of our world—which, in fact, even supports Lerman’s article in that the “majority illusion” is weaker in graphs that are assortative.
Diffusion of innovation is the phenomenon where a new idea/innovation is introduced into the observed social network, and initially, a few people adopt this idea, and then either the idea dies down, or more and more people adopt it over time. Different people adopt to new innovations at different rates, and many papers including Rong and Mei’s “Diffusion of Innovations Revisited: From Social Network to Innovation Network” classify these people into 5 categories: innovators, early adopters, early majority, late majority, and laggards (7).
The diffusion of information through a social network is a very important field of study because it affects everyone. Being able to model a network of social relations and roles within a community, identifying leaders of clusters within that network and discovering thresholds that impede the diffusion of information gives us the power to create drastic changes in a community. Most articles I came across when researching this topic studied methods to improve the diffusion of information. In many cases this is desirable: when companies introduce innovative products into the community, they try to market them in a way that as many people as possible adopt their new products. They use the tactics of identifying social leaders and influencers who can help more people gain awareness and trust in this innovation, also they identify competitors in the market and try to outperform them, and they collaborate with other companies to gain greater influential power over the community. However, in some cases diffusion of information is undesirable, so we also need to study ways to control how information spreads through a network, including intervention of the diffusion.
When I found the article by ResearchFeatures which discusses Professor Thomas Valente’s studies of how social networks affect an individual’s health-related behaviors, I realized that since unhealthy habits and misinformation often result from the influence of an individual’s environment, they can be changed on a large scale by using our knowledge of how to control diffusion of information in a social network.
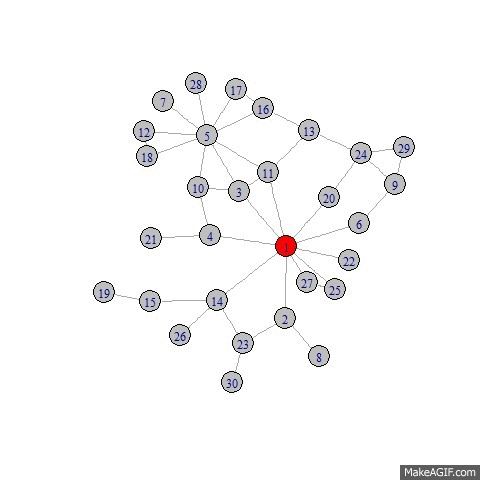
First, let’s analyze how the behaviors (both positive and negative) spread through a social network. Valente describes the network structure of a community as several dense clusters with limited connections between the clusters (see image below). This correlates accurately with the social network architecture presented in class. Examining these clusters more closely, we will be able to see that each cluster has a group leader, who has a much higher “out” degree of edges leading to the people they influence. If these leaders are the innovators, then the ideas will diffuse very quickly across the community. Considering the 5 categories mentioned earlier which represent people with varying aptitudes for adapting to new ideas, this article introduces node weights representing individual thresholds to the diffusion of information. So, the quicker an individual can adapt to a new idea, the faster the idea can spread to their connections and so on.
To battle the spread of behaviors that negatively affect individuals’ health, Valente proposed four intervention strategies: identification of influential change agents, group segmentation, induction, and network alteration. The first strategy – individual interventions – involves targeting opinion leaders to influence their behavior, and then depend on these individuals to propagate these good habits on their followers (or, conversely, to intervene with their negative influence to stop its propagation). The second strategy involves creating segmentation interventions – helping small clusters of individuals overcome a negative habit or to embrace positive ideas. This is also effective because the probability and speed of the average person adapting an idea in a community are directly proportional to the percentage of their surrounding connections who have already embraced the idea. Induction intervention is a strategy to raise exposure to positive behaviors by cascading them via word-of-mouth, commonly known as “going viral”. Finally, alternation interventions differentiate from the previous 3 strategies which take advantage of existing network strategies. In this strategy, the network is altered in order to facilitate optimal behavioral adoption by influencing social connections of individuals.
These strategies have been employed with varying degrees of efficiency even before the study of network analysis gave us more knowledge to do so more efficiently. With modern tools such as computer network simulations and the plethora of available research, we are able to influence more people at greater speeds than ever before. We need to use this power to create healthier, more educated communities.
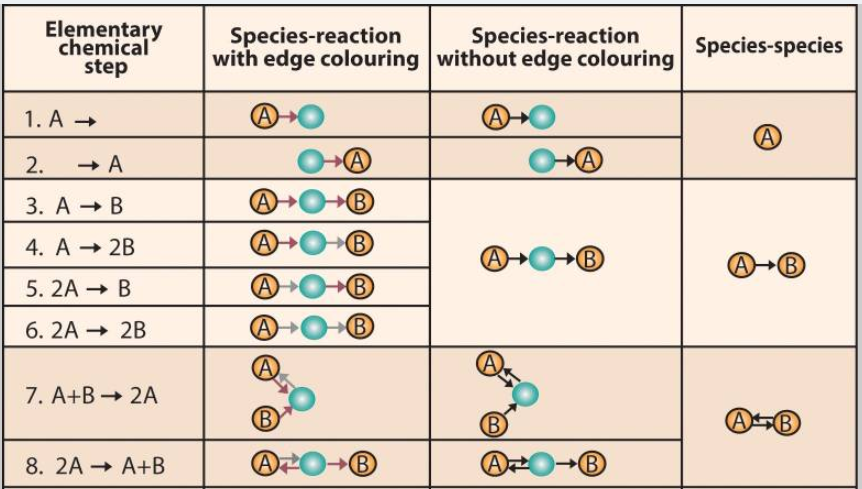
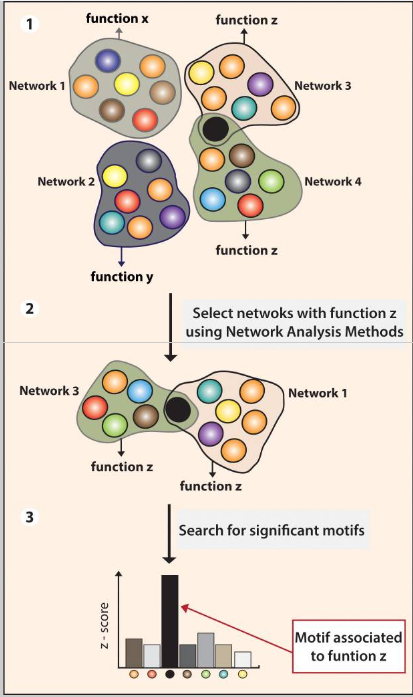
Systems chemists increasingly use network representation to investigate chemical pathways and their group. With the advent of high-performance scientific computing, graph databases (like Neo4j) gradually gain its popularity in representing chemical interaction. I will introduce how the network model and graph database boost the process to find a candidate for a particular experiment. As demonstrated in the graph below, a complex reaction mechanism can be represented by a set of elementary chemical reactions that are easily translated into a directed graph model. In this case, one node represents either one reactant or product. For one reactant, it can point to its product with edges containing the information of the chemical reaction (like the rate of reaction, the speed of reaction, reaction condition, etc). If we can get a path from the reactant node to the required product node, then there is a series of chemical interactions that can transform the reactant into the product. Suppose a chemist wants to find the fastest way to get a chemical product (Denote as D) from a given reactant (Denote as A) in such a graph database. It is logically equivalent to find a path from node A to node D what has the largest product(?) of all reaction rate (denote as ki) along the path. A chemist can even choose a reaction path with the safest experiment condition if he filters the reaction condition stored on the edges (Denote as the relationship in a graph database). The chemical interaction database saves a huge amount of time for chemists to search for a potential pathway between reactant and product.
The graph representation also brings convenience to biochemists. The systems biology definition of a network is broader and includes a variety of graphs. The nodes in a network generally represent biochemical components. Some examples include genes and proteins in a transcription network; substrates, organic compounds and so on. For this type of graphs, one Strongly Connected Component (SCC) usually represents a stable group of components that can transform into each other under some conditions. Like the Bow-tie Structure taught in the first lecture, there is a similar structure in the graph representation of biochemical interactions. The components in SCC can be formed from the components that are in the IN set of it. Additionally, the SCC can produce the components that are in the OUT set of it. By using graph representation, biochemists can have a DAG of biochemical interaction where each SCC can be identified as a compound species. They can produce undiscovered biochemist compounds by permuting different SCCs. Therefore, nowadays scientists are computationally generating a large space of possible biophysical-chemical realistic pathways and then testing them for their potential to exhibit particular biochemical functions.
One SCC is denoted as one reaction network in biochemistry
During the past decades, network theory has been proposed to analyze chemical reaction systems and biochemical pathways. An essential question for translating chemical and biochemical reactions into a network model is whether the representation is accurate and whether any information is lost. With the development of modern graph database, modern chemists save a huge amount of time to build and search for a large-scale network representation of chemical and biochemical interactions.
Reference List:
[1] Sandefur, C. I., Mincheva, M., & Schnell, S. (2013). Network representations and methods for the analysis of chemical and biochemical pathways. Molecular BioSystems, 9(9), 2189. doi: 10.1039/c3mb70052f
[2] Kim, Y., Kim, J. W., Kim, Z., & Kim, W. Y. (2018). Efficient prediction of reaction paths through molecular graph and reaction network analysis. Chemical Science, 9(4), 825–835. doi: 10.1039/c7sc03628k
In class we have discussed many properties of graphs including clustering, graph connectivity, and degree centrality and connectedness. In this blog I will outline the real world use of these properties in stock market analysis.
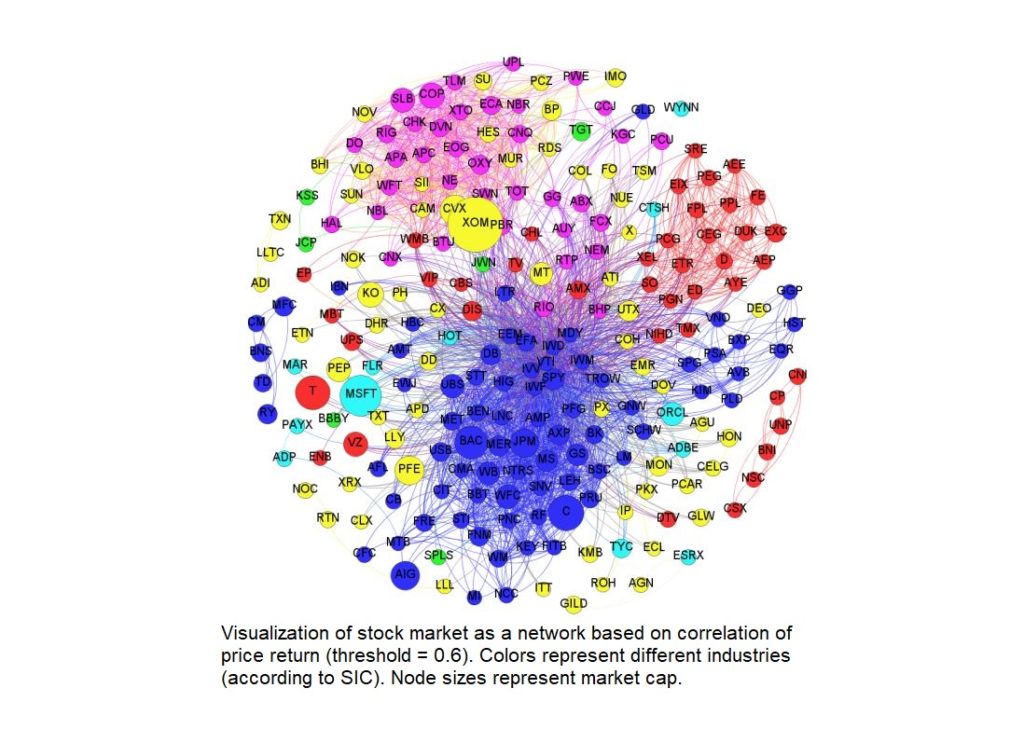
There have been many attempts to “beat” the stock market for obvious reasons ($). Traditional approaches such as technical and fundamental analysis have their believers and critics. Another approach, based on graph theoretical analysis, is also used in risk analysis and portfolio management. By nature the stock market is correlated because we live in a global economy — no company is isolated. Thus stock markets can be represented as a cluster of companies with edges forming between companies sharing a characteristic. Here we focus on the representation of the stock market as a network based on correlated stock returns. That is, If the absolute difference between the return of two stocks is less than some defined threshold theta, an edge is formed between them.
An interesting result is that after applying community detection algorithms on such a network (such as the Girvan-Newman algorithm as discussed in class), the resulting clusters were consistent with the market classifications as denoted by the Standard Industrial Classification (SIC) system; a classification of industries by 4-digit code. This illustrates that stocks within similar sectors tended to perform similarly. In class we refered to this as communities sharing the same behaviors or “birds of a feather are alike”. Using software to visualize stock return correlations offers an intuitive way to analyze the overall structure of a set of stocks, and to helps to identify key companies/market clusters — this is an important aspect of risk analysis/portfolio management.
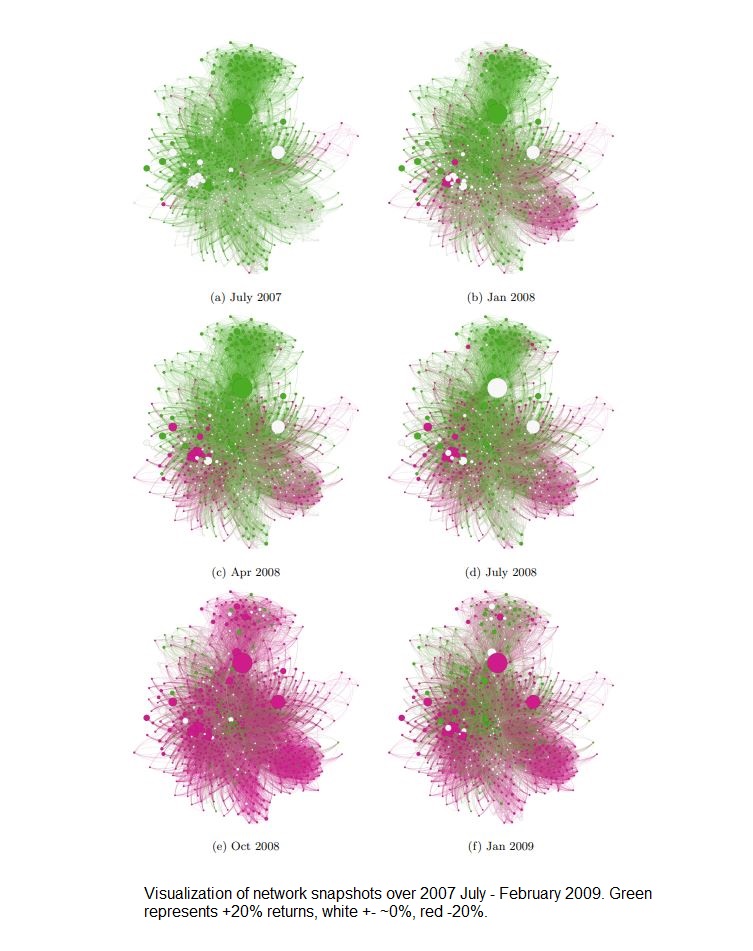
This networking model can be applied to stocks listed on the S&P 500 based on rate of return over the time frame July 2007 – February 2009. Snapshots of the network can be taken at smaller time frames i.e July 2007 – August 2007, August 2007 – September 2007, etc. to produce a series of networks depicting the progression of correlation between companies. The interesting result is that looking at the series of networks, you can observe a ‘cascading’ or spreading effect of returns in clusters. This is similar to what we discussed about network security and the spread of malicious software. Thus this network representation of the stock market could be useful in systemic risk and cascade effects prediction.
Note: this time frame represents the approximate timeline of the US Financial Crisis in ’08
Notice the ‘cascading’ effect along the graph at each time frame and how it spreads along clusters
Why network analysis over traditional methods?
Traditional approaches tend to rely on statistical properties such as variance and expected returns over time. However these typically represent localized behavior of one or two stocks and do not represent the behavior of a cluster/community of stocks. A network representation that characterizes stocks in clusters of connected components (industries) gives insight to more macro properties of the market. Properties such as degree centrality and betweeness of a stock can be identified.
A practical example is if Apple (AAPL) suddenly loses 50% of its value: semiconductor, glass screen, and other electronic hardware companies will almost surely experience similar losses soon after in a cascading effect. Network analysis can help to identify these clusters.
Limitations
Note this doesn’t mean you can beat the market with network analysis. Limitations of network analysis are that it doesn’t actually quantify how to actually achieve a better portfolio. Yes it can tell you to diversify so that your portfolio isn’t comprised of stocks all from one cluster, but ultimately it does not consider how much of each stock, at what time frame, and at what prices would be optimal points of entry/exit. Perhaps network analysis properties such as stock connectedness could be used in conjunction with a neural network to formulate a quantitative approach to optimize some return function of dollars.
References
[1] Huang, Wei-Qiang, Xin-Tian Zhuang, and Shuang Yao. “A network analysis of the Chinese stock market.” Physica A: Statistical Mechanics and its Applications 388.14 (2009): 2956-2964.
[2] Sun et al., 2015. Sun, W., Tian, C., and Yang, G. (2015). Network analysis of the stock market.
[3] 许忠好, and 李天奇. “基于复杂网络的中国股票市场统计特征分析.” 山东大学学报 (理学版) 52.5 (2017): 41-48.
One of the key ideas of has been about approaching analyzing networks as it pertains to things spreading within them. Most notably, understanding social networks can be key to understanding infection and how to deal with it. When we consider properties of graphs such as clustering coefficients, we can apply this knowledge to recognize an outbreak and control spread. However, infection is not limited to people. For example, we read in the blog post Compromised Networks about the malware known as Nodersok/Divergent and ways of preventing network attack by considering the SCCs within the network. Just as important as prevention is detection. We discuss two different graph-theoretical approaches to understand malicious code, one focused on botnet network behaviour and the other focused on code similarity.
One approach using graph-analysis from Šmolík inspects botnets specifically and how they communicate in a network, since botnets are a collection of computers controlled by the creator of malware. The leaving communication of a host is represented as a directed graph. Each vertex is an identifying triplet of (IP address, port, protocol) with a directed edge (i,j) if j was the first connection of the host after connecting to i. One of the key identifying features of suspicious code is the presence of more cycles, since attempts to communicate between a bot and its command and control server. Other notable properties in the graph of communications of infected networks include just the number of nodes in the graph, since the botnet is spreading itself much more than the average program would.
An example of suspicious network structure. Figure 3.1. Šmolík.
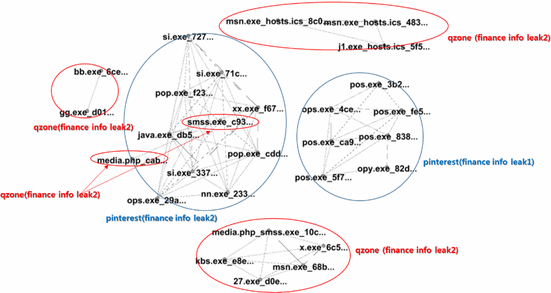
Another way of detecting malicious software is by determining their similarity in code to other software, shown in Lee, Taejin, et al. This works by creating a weighted graph where each node is some malicious software and each edge is weighted by similarity. Then, by determining clustering coefficients, we use agglomerative clustering to create communities of malware if they reach a given threshold for local similarity. This type of detection is important not only to know when you have malware on your system but determining similarity can also determine the behaviour of the given virus to prevent further spread.
Figure 5. Lee, Taejin, et al.
References
Šmolík, Daniel. “Graph-Based Analysis of Malware Network Behaviors.” Graph-Based Analysis of Malware Network Behaviors, Czech Technical University in Prague. Computing and Information Centre, May 2017, core.ac.uk/display/84833006.
Lee, Taejin, et al. “Automatic Malware Mutant Detection and Group Classification Based on the n-Gram and Clustering Coefficient.” The Journal of Supercomputing, vol. 74, no. 8, 2015, pp. 3489–3503., doi:10.1007/s11227-015-1594-6.