An Analysis of the Allegiances of the 2019 Venezuela Presidential Crisis and their Interconnections

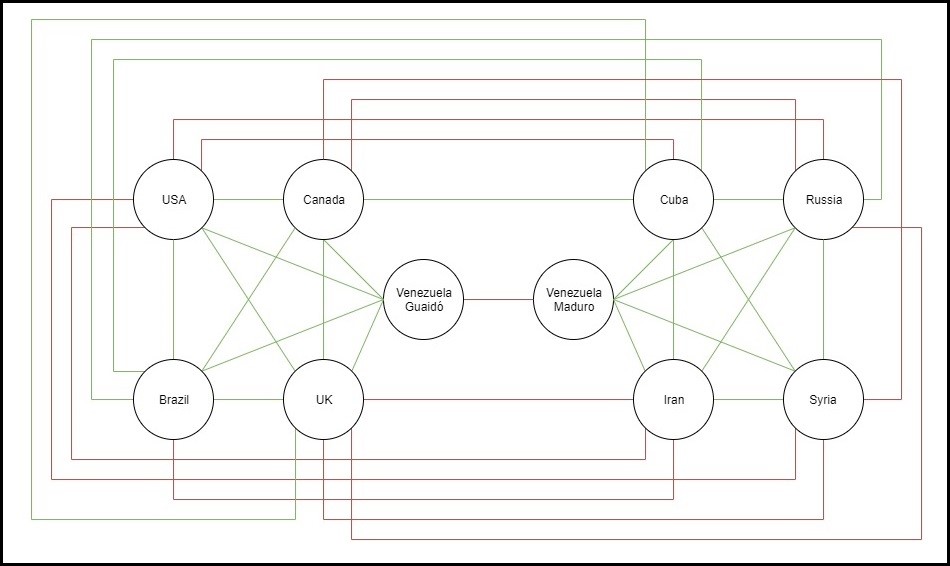
In last Monday’s class (30/09/19), we had discussed the notion of balance in graphs, following the reasoning of how relationships between friends and enemies would be structured in realistic scenarios. If you have a balanced graph, you can used known relationships to predict the relationships between nodes. For example, if you know that A is friends with B and B is enemies with C, it would be reasonable to guess that A is enemies with C as well. I thought that it would be interesting to apply this logic to a real-world situation and examine the relationships between nations. For this, I want to look at the ongoing Venezuelan Presidential Crisis. In short, the need to know is that there is a global debate regarding who is the rightful president of Venezuela between Nicolás Maduro and Juan Guaidó. Among the countries aligned with Maduro you have the likes of Russia, China, and Cuba. Of those supporting Guaidó, you would find the USA, Canada, Brazil, and the UK. Keep in mind that the full list of countries and their declared allegiances is much larger, but I just want to paint a general picture.

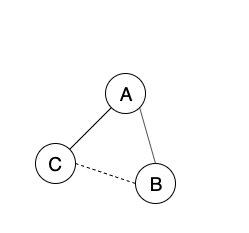
At the centre of the issue, you have the two Venezuelan parties, which can be comfortably labelled as having a negative relationship. We can also label the relationship between the Venezuelan parties and their respective supporters as being positive. This gives us two clear factions, one supporting Guaidó and the other Maduro. According to the logic dictated by balanced graphs, it would hold to reason that the countries within these factions would all have positive relations with each other and negative relations with countries in the opposing faction. This statement manages to hold in most high-profile cases, as shown in figure 1, with some examples being USA-UK or Russia-China, but there are some notable exceptions.

A prominent outlier I want to highlight is Canada-Cuba which have had very strong relations for decades. Despite this friendship, Canada and Cuba are in opposing factions regarding the Venezuelan Presidential Crisis. This Canada-Cuba relationship manages to create an unbalance in the graph, but would that strictly mean the relationship itself it prone to collapse? Over the recent months, I have not heard of any deterioration in the relationship between these two countries despite the clear difference in policy regarding Venezuela. Of course, it wouldn’t be surprising to read that there is an increase in tension behind closed doors, but as of right now, it doesn’t feel accurate to say that Canada-Cuba relations are in someway flawed. This relationship causes other issues with balance such as how Canada-Iran has a negative relationship, yet Cuba-Iran has a positive relationship.

Due to the Canada-Cuba example, I feel that it may be rather difficult to find a perfectly balanced graph using real-world data as the world is simply too intricate to be able to definitively say who are enemies and friends of whom. An important aspect to consider is that edges are binary, negative or positive. Relationships with countries are volatile and subject to change. An example is Brazil-Russia, notably in opposing factions, where their relationship has been improving, but are still in a tough position to gauge whether their current relationship could be described as friendly. Another thing to consider is a neutral relationship, such as the one between the UK and Cuba. Such a relationship couldn’t be expressed with graph balancing as each edge must be coloured as negative or positive, not allowing for neutrality of any kind. This is not to say that the notions of balanced graphs aren’t useful, but it may be more reasonable to look at an overall level of balance, such as relating to probability, as opposed to merely saying that the graph is balanced or unbalanced.

2019 Venezuelan Presidential Crisis Summary:

https://www.bbc.com/news/world-latin-america-48121148

Figure 1: Demonstrates the relationships between some of the larger countries involved in the 2019 Venezuelan Presidential Crisis

Social Networks altered by growing Information Network

With the world becoming more interconnected with the internet, people can share their ideologies with a significant amount of people without meeting them in person. This results in the barriers of communication such as distance and time differences being removed and the ability to access discussions becomes more available to the general public.

With social media and online discussion boards not being controlled by regulations and the ability for non-transparency, specific ideals can be broadcast throughout the social network without any accountability. This leads to

The inclusion of natural barriers like distance are what prevent the intermingling of individuals in different areas, leading to natural filters that regulate the flow of information. Without these barriers, location is no longer a main factor when analyzing the social network.

Figure 1: The structure of the social network affecting the voters’ perceptions of information

As a result, the analysis of social and information networks cannot solely rely on the location of a individual node in a geographic area as its edges connecting other nodes may be in significantly different areas.

This is interesting with respect to the course because a simple graph with edges connecting nodes that communicate with one another does not give a complete picture of the situation, as the actual network has location as part of the structure and the channels of communication can be unpredictable.

Big data loads and enterprises

The study shown in the article tells us the surprising fact that most enterprise networks are actually incapable of handling big data loads. With the rise of technology and the fact that most households now have access to a device that is hooked up to the web through personal devices or public ones in the library. It is very surprising that a large number of companies cannot handle the flow of data through their networks. Just like what was said in class, a graph could be used to represent the networks we use for the internet, with the nodes being the devices (routers, switches, etc for either the enterprise or just any normal household) and the edges being the connection between two nodes (a connection meaning they can send data packets to each other). Lots of information are being sent every day and it seems that the speed at which technology is coming out exceeds the rate at which our companies can handle right now.

This is really interesting to me because with how much money there is to be made from the tech industry, I would guess that businesses are able to keep up with the growing demands. The reality of the situation, however, is not too surprising because of how big those networks are. The ones talked about in class with only 15 nodes are already really confusing to look at so when thinking about the billions of devices around the world, it makes a lot more sense why it is really complicated to pull off. This has really opened my eyes because it has made me understand more about the scope of these networks and how large of a scale they operate at.

https://www.networkworld.com/article/3440519/most-enterprise-networks-cant-handle-big-data-loads.html

Decentralized communications allows for more robust networks

I saw an article describing the use of decentralized communication with Bluetooth used by protestors in Hong Kong. (Wakefield, 2019) The decentralization of communication relates to the ideas in CSCC46 of network robustness and the connectedness of graphs.

In the protests, many protestors were using the messaging app Telegram to coordinate protests, and to communicate in a large group. However, this had a few issues. Telegram, as a cloud-based messaging app uses a centralized network model, where communications between devices must travel through their server. (Telegram, n.d.) For example, for ‘Alice’ to contact ‘Bob’, through Telegram, Alice sends a message from her phone, to Telegram’s server, who sends it to Bob. However, this presents a few issues. First, in a large protest with many people, cell towers can quickly become overloaded, making it difficult to send messages. Another point of failure is that if Telegram’s server encounters issues, then a message cannot be sent, this happened in June 2019, when Telegram’s servers faced a DDOS attack. (Shieber, 2019)

Due to these risks, protestors started using apps such as Bridgefy and Firechat, which use peer-to-peer communication through Bluetooth to communicate. (Wakefield, 2019) In the context of a protest, it seems feasible. In a crowd, people are physically close together, so Bluetooth’s short 100m range is not an issue. (Wakefield, 2019) If a cell tower is overloaded, the users in that immediate area can still communicate with other users in the immediate area. If there are many users in the area using the app, they all assist in distributing messages to each other.

In the context of CSCC46, if we consider devices and equipment such as phones and cell towers to be nodes, and a connection between them to be edges, this decentralized communication allows for greater network robustness, as the graph does not quickly become disconnected when one important node (the cell tower) is removed. The distance between nodes can also be shorter, as the minimum distance is now phone directly to phone, instead of travelling through a cell tower and a server. This allows for more stable communication in tightly packed local areas, as long as there are enough nodes.

Centralized network, cell tower is a single point of failure
Decentralized network, each node (user) can communicate with each other independently

Decentralized communication through Bluetooth allows for a more robust network in small areas. This has applications outside of protests in any event with large crowds which may overload cell towers, such as a baseball game, a concert, or a natural disaster. (Bridgefy, n.d.) Using our knowledge of CSCC46 helps us analyze why some forms of communication can be more stable than others in certain situations.

References:

Bridgefy. (n.d.). Bridgefy. Retrieved from Bridgefy: https://bridgefy.me/

Shieber, J. (2019, June 13). Telegram faces DDoS attack in China… again | TechCrunch. Retrieved from TechCrunch: https://techcrunch.com/2019/06/12/telegram-faces-ddos-attack-in-china-again/

Telegram. (n.d.). Telegram Messenger. Retrieved from Telegram: https://telegram.org/

Wakefield, J. (2019, September 3). Hong Kong protesters using Bluetooth Bridgefy app – BBC news. Retrieved from BBC News: https://www.bbc.com/news/technology-49565587

Leveraging Community Detection Algorithms for Machine Learning

Hey everyone.

Today I want to discuss an interesting new study that came out recently involving the usage of social networks as a tool to group datasets for machine learning models. A paper named The Power of Communities: A Text Classification Model with Automated Labeling Process Using Network Community Detection published by Minjun Kim and Hiroki Sayama on September 25th, 2019 highlights a useful application of network logic and analysis as it relates to training machine learning text classification models.

If anyone has worked in data science before, you’ll understand the enormous amount of time that is spent on ETL – extract, transform, and load. On top of that, the data needs to be labelled and feature engineered to be able to extract useful insights from it. These two researchers describe how supervised and semi-supervised data are often associated with pre-defined keywords or data which impacts classification. The other clustering algorithms, such as k-means relies biases towards words which repeatedly appear in different contexts, biasing the model and introducing unnecessary ambiguity. The paper explains Kim and Sayama’s methods on how to apply a network community detection algorithm in grouping the preprocessed sentences into different communities and trying to extract insights from that.

Particularly interesting, is that the method for network detection in their paper is the Louvain modularity algorithm for network community detection. This algorithm is based on evaluating density of network links. This relates well to our class discussions on strong and weak ties, as the Louvain algorithm measures modularity as a value between (-1, 1) of the density of links inside communities compared to links between communities. This Louvain method actually relates to the Girvan-Newman algorithm as it was based on that algorithm, instead introducing an aspect of heuristic analysis and local optimization on top of the original algorithm.

I found this topic interesting because it showcases the various applications of network theory. By vectorizing sentences, we can discern mathematical properties that relate sentences semantically with each other and draw out communities without using natural language processing. This application is especially interesting as it shows a concrete application of community detection as we saw in class, and how it relates to cutting-edge modern academia research. For anyone interested, I have included a diagram of the communities as detected in the paper by Kim and Sayama below.

Citation:

Kim, M., & Sayama, H. (2019, September 25). The Power of Communities: A Text Classification Model with Automated Labeling Process Using Network Community Detection. Retrieved September 30, 2019,  from https://arxiv.org/abs/1909.11706v1.

Needham, M. (n.d.). 6.1. The Louvain algorithm. Retrieved September 30, 2019, from        https://neo4j.com/docs/graph-algorithms/current/algorithms/louvain/.

The Role of Networks in Disease Prevention

The understanding of networks is crucial in regard to the process of disease prevention. The importance of the effects of wind in the spread of disease is highlighted in an article by Joel H Ellwanger and José A B Chies at, thelancet.com

The channels of wind that carry the airborne vectors, such as mosquitoes, may be interpreted as a directed link in a network. The spread of Malaria is affected by wind speed and direction (Chies and Ellwanger). The links may be weighted with respect to the strength of the wind, number of mosquitoes, potency of the virus, etc. Since it would be near impossible to represent every organism as a node, the nodes of the network would be a geographic segment of hosts of the virus, which includes animals. For example, villages, towns, cities, forests, natural habitats, etc.

An example graph of the spread of airborne diseases.

This network may be converted into a mathematical graph, such as those seen in CSCC46 at the University of Toronto. Then, graph theory and analysis may be conducted on such graphs. The clustering coefficient is the measure of how much clustering occurs among nodes in a graph. The degree of a node is how many connections it has to other nodes. By analyzing the clustering coefficient and degrees of nodes on smaller portions of the graph, common sources of the virus may be deduced, as nodes would be clustered more densely around these sources. A breath first search of the graph, starting from any one of the sources, can be used to see how airborne diseases spread throughout time. Then, preventive measures may be put in place around these sources and other densely clustered areas to prevent the future spread of the disease.

By analyzing the networking behind the spread of airborne diseases, future outbreaks of these diseases may be more efficiently prevented. This study highlights the importance of network analysis and its countless applications to real world problems.

Russell, D. A., and Michael Winterbottom. “Wind: a neglected factor in the spread of infectious diseases” The Lancet, Elsevier Inc., 1 November 2018, https://www.thelancet.com/journals/lanplh/article/PIIS2542-5196(18)30238-9/fulltext

Strong Tradic Closure When Finding a Job

This article talks about the impact of weak ties to the job seekers and recruiters, however, the author only talks about the impact for the recruiters side. There states if a company wants to build a team with talented people, it is more likely for the company to hire people with talent because of the new employee is the bridge to other networks of great people. This is because of the strong readic closure we talked about in lecture. In this network, the relationship between networks is not only friendship, but also the employment relationship, the weak ties still exist between the company and the network of an employee and the weak tie has some effect such that the employee could offer a referral to his or her network so that the company would hire them in the end.

This is interesting because for students who are about to graduate, and after graduation, they have to find jobs. Sending as many as possible resumes to companies is a choice to find a job but this way is not efficient and there is a small chance to get the interview invitation from the company. To know someone who is working or has worked in a company and let him or her provide a reference seems to be a good choice. Although the article does not talk about the impact on the seeker side, but the weak ties do have impact on both ways as the job seeker could be recommended to the company because they can get referrals, and the company is more likely to hire them (weak tie effect) if they do have the skills to meet the requirement.

Reference:

Harper, Everett. “Weak Ties Matter.” TechCrunch. TechCrunch, April 26, 2016. https://techcrunch.com/2016/04/26/weak-ties-matter/.

Facebook’s ‘Like’ Hiding Experiment – Could there be more to it than meets the eye?

The news article I will be discussing is headlined “Facebook Tests Hiding ‘Likes’ on Social Media Posts”. To summarize, Facebook began an experiment in Australia on September 26, 2019 where Likes, video view counts, and other similar metrics found on posts became hidden to users other than the original poster with the goal of reducing the significance of such measurements. In order to see if they are succeeding in improving users’ overall experience using their application, Facebook will be studying whether users would continue to comment and Like posts even when the numbers are not visible to them. An example of this can be seen in the picture provided below. Considering that the experiment is still ongoing, I will be considering three possible results that came to mind and how they relate to the material taught in the course CSCC46: Social and Information Networks. The cases that will be discussed are whether people will leave Likes and comments more often or less often, while we will not be going too far into detail about the trivial case, where there may simply be no significant changes to users’ behaviour.

As was mentioned in lectures several times, social media applications including Facebook have many different graphs in their backend that represent friendships, pages Liked, etc. These graphs are used to perform analysis to improve the application’s services such as friend recommendations and targeted advertisements.

Thus, as a result of the experiment, it is possible that users start to leave Likes and comments on posts that they otherwise would not have. For example, if a post already has thousands of comments on it, a user may decide not to leave a comment since they may think that their comment would not contribute anything to the discussion if they are too late to the post. However, if users do not know this quantity, then they may start leaving comments on posts whenever they feel like it without hesitation. This would likely lead to more connections being formed not only in real life, but in Facebook’s backend as well. Although there may be no significant immediate effect, if Facebook decides to keep the numbers hidden in the future, then there will definitely be a difference in their graphs than if they did not conduct the experiment at all. For example, although more connections may be found, a good chunk of these would likely be weak ties and some may even be negative edges, but communities would be larger in general. This change in their graphs may lead to the outputs of their machine learning and graph-related algorithms to be changed as well. For example, users may start to get more (possibly inaccurate) friend recommendations as well as advertisements for a wider variety of products.

Conversely, the experiment may lead to users to start limiting the amount of Likes and comments they leave on posts. For example, a user may start only wanting to leave Likes and comments on friends’ posts only. In this case, less connections would be formed, causing the communities found in the graphs to be more tightly-knit with more strong ties and positive edges. This may result in the previously mentioned algorithms to seem smarter since they would be more accurate in tracking our behaviours and interests. Also, let us not forget that it is possible that Facebook is selling our data, which could potentially lead to a difference in users’ experiences while using other applications as well.

In conclusion, although Facebook’s little experiment may seem trivial or insignificant, with further analysis, it has the potential to change users’ behaviour on their application. This could lead to a drastic change in the backend data as well as the services and content that people are exposed to not just on Facebook, but the other companies that they work with as well. However, it is possible that there could just be no real change in user behaviour; since this experiment is still in progress, we will see how this experiment goes but will not know the outcome until sometime in the future. Most of the ideas that were discussed here are hypothetical and are just my opinion, I happily welcome your thoughts and feedback. I also encourage you to read more into the articles referenced below if you are interested since all that was discussed here was a high-level summary and it also mentions how Instagram, another social networking service owned by Facebook, performed a similar experiment earlier this year with similar goals in mind.

Reference List:

Conger, K. (2019, September 26). Facebook Tests Hiding ‘Likes’ on Social Media Post – The New York Times. Retrieved September 27, 2019, from https://www.nytimes.com/2019/09/26/technology/facebook-hidden-likes.html

Hutchinson, A. (2019, September 27). Facebook Begins Hiding Total Like Counts on Facebook Posts in Australia | Social Media Today. Retrieved October 1, 2019, from https://www.socialmediatoday.com/news/facebook-begins-hiding-total-like-counts-on-facebook-posts-in-australia/563829/

Cross the World within Six Steps

Friendship takes up a significant portion of our social network, a good friendship can enrich our lives as well as increase your chances of happiness as an adult. However, we are not taught much about how to form a friendship. Indeed, building a relationship with someone is difficult, there are lots of factors need to be taken account of, such as education level, distance, age etc. Nevertheless, there is at least one essential requirement: You have to share something in common with that person.

“People You May Know” just got Creepier

Have you ever noticed how Facebook’s “People You May Know” just got creepier? In fact, If two people in a social network have a mutual friend, there lies a reasonable probability that these two people might become friends at some point in the future, this is called the triadic closure.

Triadic Closure

The dashed line indicates that B and C might potentially build a relationship. What’s more interesting behind our social network is that if we randomly choose two people across the world, we only need six or fewer people (nodes) to construct a social connection between them. On April 24, 2019, a blog on exploring your mind called “The Six Degrees of Separation Theory” by Angélica interested me. This idea was originally set out by Frigyes Karinthy in 1929 and popularized in an eponymous 1990 play written by John Guare. It is sometimes generalized to the average social distance being logarithmic in the size of the population.

Six Degrees of Separation

The theory claimed that due to the ever-increasing network connectedness caused by technology, our world is “shrinking”. That is, even if the physical distance among two arbitrary individuals is great, the rapidly growing density of human networks made the actual social distance far smaller. If we consider a person as a node in the social network, and the number of friends they have as edges, it is not hard to imagine if a node has an extremely high node degree, then it is connected to many other nodes on the graph with a path.

The more degrees, the more connections?

In the context of CSCC46, we know that the probability that a random pair of nodes are connected on the graph is determined by the clustering coefficient, which is the quotient of the number of edges between the neighbours of a node and the degree of that node. And the average clustering coefficient is the sum of all nodes’ clustering coefficient divide by the total number of nodes. We can reveal that Karinthy’s hypothesis is true in today’s digital era. Every time when we like a post on Facebook, a video on YouTube or an image on Instagram, we somehow established a digital connection on the network, and we perform these actions constantly without realizing it. When there is more and more such digital connection on our social network, the clustering coefficient for each node increases and resulting in a higher chance that two random nodes are connected.

A social network is not only a matter of friendship, but it can also be applied to many other fields such as Theoretical Biology. José Carlos Santos & Sérgio Matos did an infodemiology study that evaluates the use of Twitter messages and searches engine query logs to estimate and predict the incidence rate of influenza-like illness in Portugal. And Vasileios Lampos proposed a method to track flu in the population using social networks. He first identified a set selected keywords to be looked for in Twitter posts, and collect a set of daily twitters, if any keyword is found in the tweet, it will be marked as 1 and 0 otherwise, and a set of equations turning statistical information into flu-score for different regions and areas.

There is still many myths about the social networks that we have not revealed its veil yet. For example, the friend paradox: people tend to have fewer friends than their friends, and homophily: the tendency for people to have (non-negative) ties with people who are similar to themselves in socially significant ways. In today’s era, it is not surprising to believe that the idea of six degrees of separation is true, and it has been several decades since this topic was popularized, who knows what number of degrees it will be now, maybe it is the same or smaller.

Reference:

Alessa, Ali, and Miad Faezipour. “A Review of Influenza Detection and Prediction through Social Networking Sites.” SpringerLink, BioMed Central, 1 Feb. 2018, https://link.springer.com/article/10.1186/s12976-017-0074-5.

Angélica. “The Six Degrees of Separation Theory and How It Works.” Exploring Your Mind, Exploring Your Mind, 23 Apr. 2019, https://exploringyourmind.com/the-six-degrees-of-separation-theory/.

Carlos, José, and Sérgio Matos1. “Analysing Twitter and Web Queries for Flu Trend Prediction.” Theoretical Biology and Medical Modelling, BioMed Central, 7 May 2014, https://tbiomed.biomedcentral.com/articles/10.1186/1742-4682-11-S1-S6.

Frei, Lukas. “Predicting Friendship.” Medium, Towards Data Science, 11 Feb. 2019, https://towardsdatascience.com/predicting-friendship-a82bc7bbdf11.

“Homophily.” Software, http://www.analytictech.com/mgt780/topics/homophily.htm.

Morse, Gardiner. “The Science Behind Six Degrees.” Harvard Business Review, 1 Aug. 2014, https://hbr.org/2003/02/the-science-behind-six-degrees.

Silver, Curtis. “How Facebook’s ‘People You May Know’ Section Just Got Creepier.” Forbes, Forbes Magazine, 11 Oct. 2017, https://www.forbes.com/sites/curtissilver/2016/06/28/how-facebooks-people-you-may-know-section-just-got-creepier/#47b743245f5a.

“Six Degrees of Separation.” Wikipedia, Wikimedia Foundation, 25 Sept. 2019, https://en.wikipedia.org/wiki/Six_degrees_of_separation.

“Tracking the Flu Pandemic by Monitoring the Social Web.” Tracking the Flu Pandemic by Monitoring the Social Web, Institute of Electrical and Electronics Engineers, 2019, https://ieeexplore.ieee.org/abstract/document/5604088.

Welcome to the CSCC46 course blog!

Hi everyone, welcome to the blog! This is where you should publish your blog posts. Here is some information that should help you get started:

Each post should be centered around a recent news article, academic paper, online essay, new company or organization, that is somehow related to the material in the class. Your goal is to provide commentary that engages with the subject, and your audience is your peers in the course, as well as interested outside observers. What is interesting or novel about your subject? Why did you choose to write about it?

Posts should be at least two paragraphs long, clearly articulate the relation to the class material, and contain at least one picture/graphic and at least one web link on that subject. Blog posts are to be written individually.

One of the purposes of these writing assignments is to practice communicating your thoughts in a public forum. Your audience is each other, not just the course staff. Posts that dialogue with earlier posts from the course are encouraged, but they should add significantly to the previous points made (in part by referencing a new paper/article/essay). Participating in this blog — writing posts, leaving comments on others’ posts, etc. — is part of the participation grade in this class. Feel free to comment on each other’s posts!

Keep in mind that the blog is a public forum, and that companies, organizations, people, or research projects in the outside world that you refer to may well end up reading what you write. Please be respectful.

Have fun!