Game Theory in the Role of Vaccinations and Epidemics

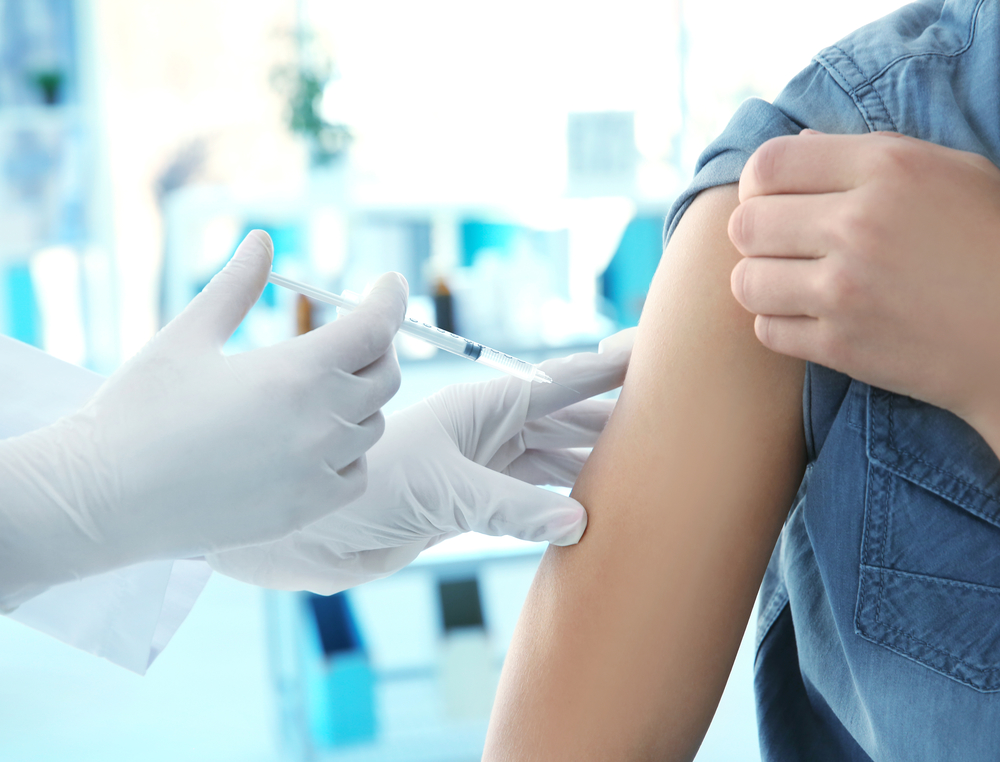
In epidemics there is the basic reproductive number R_0 is crucuial in determining if epidemics can blow up or die out. Ideally we want R_0 to be below 1 in order for the epidemic to die out. One way would be to reduce p, the probability of infection. Vaccines seem like an obvious and simple way to reduce p, however not everyone gets vaccinated. A recent study published this year called, Epidemic prevalence information on social networks can mediate emergent collective outcomes in voluntary vaccine schemes, analyzes the effect of vaccination on epidemics while using game theory.

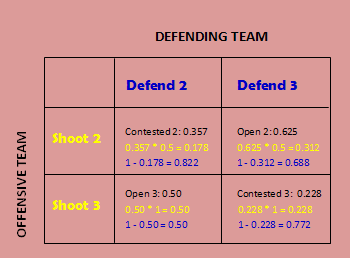
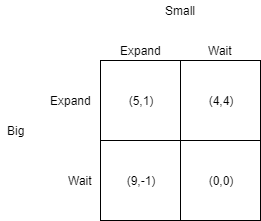
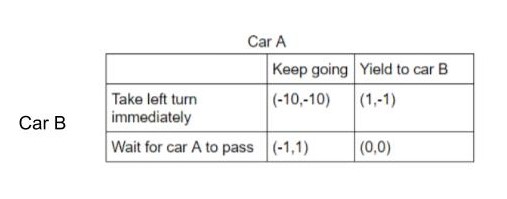
Getting vaccinated can be viewed as a payoff matrix. Getting vaccinated requires time which many value more. On the other hand, herd immunity can still protect unvaccinated individuals at no cost as long as enough of the population is sufficiently vaccinated.As a result, many individuals may choose to not get vaccinated but still be protected by vaccines because there are less infectious people. For rational agents, it may seem disadvantagous to sacrifice time to get vaccinated when the individual still benefits from herd immunity regardless.

In the study researchers studied the dynamics of epidemic spreading and vaccine uptake behaviour on a social network containing N people. The model uses the popular SIR epidemic model with transmission rate β, and average infectious time period of τI. In the study they varied the transmission rate and average time period. One unique aspect of the model is the introduction of vaccinations, which prevents susceptible individuals from being infected, which makes them functionally similar to recovered individuals.

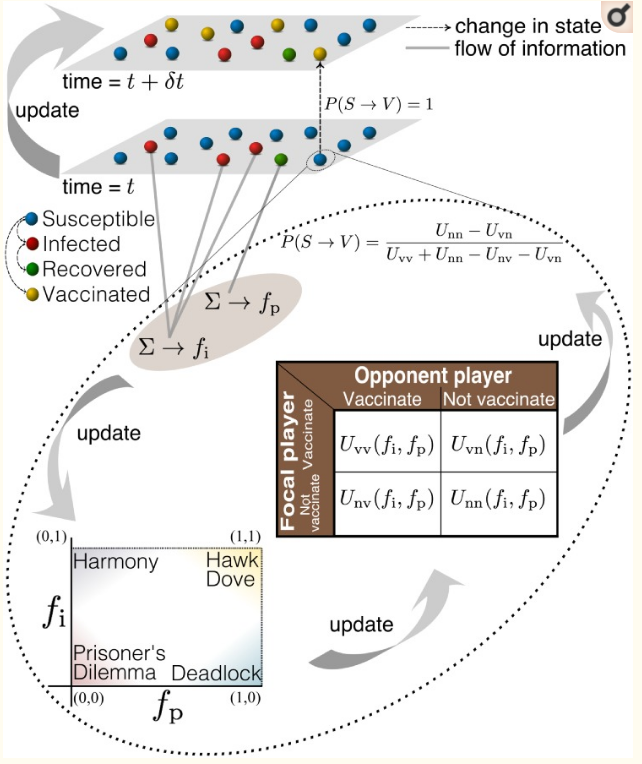
Individuals have access to local information such as number of infected cases among direct contact neighbours in the network, and global information about how prevalent the disease is across the whole network. The player’s payoff matrix evolves as time passes, since the payoffs are based on the disease prevalence, where a higher prevalence of diesease increases the payoff for getting vaccinated. Interestingly, the payoff to not vaccinate increases as the number of direct neighbours are vaccinated or immune to the disease.

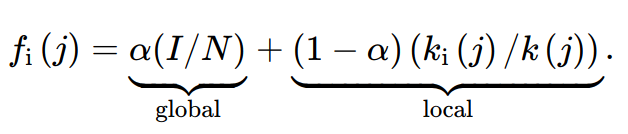
The formula for the payoff of vaccination scales based on α∈ [0, 1], which is a weight factor determining the impact of global vs local information. For example, if α=1, then individuals only considers global information on the epidemic when determing the payoff matrix for vaccinate/don’t vaccinate, but if α=0 then the individuals only consider local information.

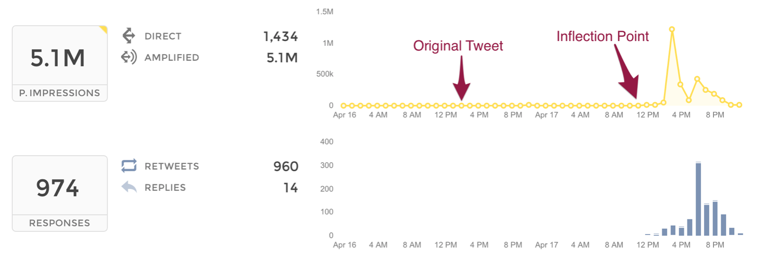
The results of the 1000 epidemic simulations with β= 0.025 , τI = 10, and α=0 or α=1 are shown above. When α=1 people don’t initially get vaccinated, but when the epidemic becomes significantly higher then there is a mass surgence of vaccinations, akin to how media exposure only occurs when epidemics grows large which in turn can trigger vaccinations. Also, the fraction of infected, inf, is always higher in α=1 regardless of R_0, which is in line with the observation that people get vaccinated based on global epidemic data. This may suggest that dispersing local information about epidemics is more important than global information.

This study shows the importance of information dispersal in combatting epidemics. The results may suggest more efficient disease control by providing local information. It is also interesting to note how payoff matrices can change in relation to the environment.

Links:

https://www.ncbi.nlm.nih.gov/pmc/articles/PMC6532839/

Game Theory in Basketball

Game Theory is dependent on the idea of Nash equilibrium. Nash equilibrium, the situation when neither of the players can choose any other strategy than the one in Nash equilibrium in order to get a better payoff. We can apply the same in the sport of basketball. Imagine a game coming to a winning shot. There are certain scenarios in order to win the game and to lose the game. Considering one of the situations where the loosing team is down by two points, has ball possession and say 20 seconds on the shot clock and the game as well. The team takes a shot. The shot can be either a two-pointer or a three-pointer, two-pointer having higher possibility. With a two-pointer the game would go into an overtime, but instead having a three-point shot, although with less probability, would help win them the game. The paper assumes having a 50% chances of winning upon going into overtime. On the other hand, the current winning team also has two choices. One is to defend the three-pointer, while risking an open two-point shot. The other is to defend the two-pointer shot, but risk the three-pointer shot from the opposite team.

Based on the data collected in the paper, there is no dominant strategy for either team. They have to play a mixed strategy in order to be unpredictable for the other side. After some calculations, the mixed strategy equilibrium comes out to be (p , q) = (0.670 , 0.207), p being the chances of offensive team taking two-point shot and q being the chances of defending team saving the two-point. For the leading team to win, they should defend the three-point shot and not worry about the overtime as in that they would have a 50% chance to win as previously seen. The decision is a tough one for both sides and this relates to many real life interesting situations such as this Finals game.

Reference:

https://mindyourdecisions.com/blog/2012/06/19/game-theory-applied-to-basketball-by-shawn-ruminski/

Game Theory and Disease Outbreak Prevention

We’ve seen numerous disease outbreaks occur. The Ebola virus in West Africa, Cholera in Yemen, Hepatitis A in the United States to name a few. The spread of disease, which leads to major outbreaks is a very important and interesting topic. Everyone should make a conscientious effort to be well informed and take appropriate measures to prevent outbreaks .

When reading the title of this blog, one might wonder, How on Earth does game theory relate to disease outbreaks? In a recent article titled, “Game theory can help prevent disease outbreaks”, by authors Istvan Zoltan Kiss and Nicos Georgiou, they showed how game theory can and does play a big role in disease outbreak prevention.

When it comes to decisions about health, what’s best for us individually might not always be the best thing for the whole population, and vice versa. This leads to difficulty for authorities in making decisions to protect the populace. It’s easy to see how game theory ties into this problem.

Image result for vaccinations"
A person getting vaccinated.

A good example of this that the article talked about was the approach of having the population take vaccination, as shown in the image above. Vaccines have been proven safe, but they can have short-term negative effects such as, financial cost, pain from injection, a temporary reaction from the immune system. When deciding whether to get vaccinated, one has to weigh up these costs against the benefit of getting vaccinated to protect themselves from the disease. It might seem obvious to accept the costs and get vaccinated, but what if everybody else in the population gets vaccinated? You’d be relatively protected, so not getting vaccinated might appear to be the better choice. The problem with this is that if everyone thought like this then no one will be protected and a major disease outbreak could occur.

How would a best strategy in situations like this be determined? The article brings up the idea of Nash equilibrium. In some cases the optimal strategy for an individual can also be optimal for the population as well. The understanding of Nash equilibrium can help authorities in choosing strategies for disease outbreak prevention.

An example of this would be a situation where people from one area could choose whether to travel to another area affected by the disease or not. If the risk of disease was high because the outbreak was publicised in the news, individuals would logically choose not to travel. This would be beneficial with authorities in their desire for a travel ban to that area affected by the disease. Here, having the severity of the outbreak publicised in the news, helped tourists in implementing a travel ban, because they understood that an optimal strategy for individuals then would be to not travel.

Image result for game theory and disease outbreak"
Numerous people travel everyday and diseases can be spread very easily, if not for numerous control measures in place, such as travel bans.

Evidently, game theory can help in making sense of all the factors for finding out when individuals are most likely to act in a way that isn’t beneficial to the group. In response to that, authorities can then implement appropriate measure in order to decrease the chance of a disease outbreak.

References

https://theconversation.com/game-theory-can-help-prevent-disease-outbreaks-102934

https://www.contagionlive.com/news/the-10-biggest-infectious-disease-outbreaks-of-2017

Why you shouldn’t make rational decisions.

While it might have the word ‘game’ in it, Game Theory can be applied to almost any interaction to explore the reasons why certain choices are made and what the best ones are in any situation. A popular example of game theory is called the prisoner’s dilemma, where two people who cannot communicate with each other but think rationally try to maximize their benefits when making a decision that affects both themselves and the other person.

Of the two who are suspects in a crime that needs a confession, they are offered a deal where if one confesses while the other doesn’t, they get to go free while the other stays in jail for, say 10 years. If neither confesses, they each get 2 years in jail, while if both confess, they each get 5 years. This can be visualized in a grid called a payoff matrix.

Looking at this, the best option for both of them is to both stay quiet, because they each only get 2 years. But if each person is thinking in terms of what would benefit them the most, they will each choose to confess. The reasoning behind this being that, if for example the A does confess, and B does too, they move from 10 to 5 years in jail; and if A doesn’t confess, and B does, they move from 2 to no years in jail. In both cases, the number of years B spends in jail decreases. A, however, is thinking the same thing, and so they each end up spending 5 years in jail. These decisions have come to an equilibrium where no one can make a decision that benefits them further, even though it is not the best option for anyone.

This system works for most decisions where the costs and benefits can be defined, for example, if we wanted to consider the decisions made when driving versus taking the bus. 

Above, the best option for each player, as with the prisoner’s dilemma, is to drive, and the results with two players don’t seem to illustrate any problem, but if we consider that each person who needs to get somewhere might have to make that same choice, the results can be visualized as below where we have two groups that can decide to take the bus or their cars.

The more people drive, the worse the roads become, but driving might always be somewhat better than being on the bus if traffic isn’t too bad. If the participants are only considering their individual benefits, the payoff can come at a cost to not only the people involved but their society as a whole. 

Everyone can still get where they want to go if they take the bus, but “If everyone is taking the bus I can take the car,” thinks everyone, and so the roads get filled by cars and the air gets filled by smog. This sort of problem, where individual benefits on shared resources detract from the common good and in the end affect the individual themselves negatively is known as the ‘Tragedy of the Commons’.

A rational agent might make a choice that is good for them alone, but it would be their whole society that pays the cost of the choice. One might ask every house in a neighbourhood to pay a small fee to keep the streetlights on, but if every house assumes they can get the light because everyone other than them will pay, the streets would stay dark.

The socially optimal equilibrium of the matrix would be for everyone to pay the small fee so that everyone can pay and benefit, but this is not the equilibrium most would reach if they were being rational agents after their own profit.

Citations:

Game Theory on companies expand the market

Game theory is the study of mathematical models on how two entities make decisions against each other so that they are able to get the maximum benefit. This useful theory can explain a lot of phenomena in the marketing including why often small companies have difficulties expanding the market like the huge companies. Game Theory can be used to explain it.

Let’s assume theoretically, there are two companies, one is a big company A and the other one is a small company B . They both find a new product that can be introduced into the market and expand it. The product values 10 million dollars in the market, Here are three situations: 1. A, B expand, earning ratio 7:3. 2. A expands, B wait, earning ratio 6:4. 3. A waits, B expands, earning ratio 9:1. Each expansion cost 2 million dollars. Here is the diagram that shows the profit each company makes in different choices. What strategies would they make to maximize their profit?

As a matter of fact in this model, the choices are not made simultaneously. Obviously, no company wants to wait forever, someone has to expand the market to make profit. If the small company B expands the market first, it would have 1 million dollars deficit. Therefore, B must wait for A to expand the market first. This strategy is reasonble in real life because introducing a new product into the market always has a cost, and by the time the expansion is done by B, A gets most of the share from the market. Therefore, B must wait for A to expand the market so that B has time to prepare and take more market shares. As for A, A must know B will wait for it, but A does not want to wait either, otherwise they both get nothing. A will eventually develop and introduce the product to the market. Thus, (Expand, Wait) is a Nash Equilibruim.

Reference: https://www.youtube.com/watch?v=Upd1ESkn-Bo

Trump: A Dangerous Political Cascading Effect

With all the news and controversy around Trump and his possible impeachment, something that is not brought up enough is his influence and impact left upon other world leaders. I’m not talking about the impact and influence he inherited as a by-product of leading one of the world’s most impactful countries but rather the impact and influence of his remarkably different leadership style. Compared to Obama’s relatively honest presidential term where The New York Times claims that he only lied 18 times1 within his 8-year term; Trump has been unabashedly aggressive and has lied time and time again even to the point of attacking journalists he disagrees with. Unfortunately, Trump’s tactics have worked, and other leaders have taken notice.

Now elected leaders in other countries such as Brazil and India are starting to mimic his tactics of harassing journalists to suppress news that may paint them in a negative light. This is an interesting parallel of the cascading effect. Previously, elected leaders had to lead honestly and follow certain societal guidelines in fear of angering the masses, thus losing their influence over the nation. Trump has completely flipped the script and has demonstrated that if you decide to just go on the offensive, things will work out for you, and unfortunately other countries are copying the tactic. This would be as if there was a new social media tool that was so impressive that it didn’t matter that most of your friends shunned it for having shady practices and morals, the benefits are potentially so large that it only took a couple of friends to use it to cause you to use it too. This cascading effect can be terrifying as we know that it only gets easier for a cascading effect to occur as more people within the network follow suit. If more and more people decide to follow suit we may be in for a world with more and more leaders who imitate Trump and if the popular vote is anything to believe in, even the Americans didn’t want that.

Reference Article

https://www.washingtonpost.com/opinions/global-opinions/trump-is-spreading-his-fake-news-rhetoric-around-the-world-thats-dangerous/2019/11/19/a7b0a4c6-0af5-11ea-97ac-a7ccc8dd1ebc_story.html

Works Cited

https://www.nytimes.com/interactive/2017/12/14/opinion/sunday/trump-lies-obama-who-is-worse.html

https://www.washingtonpost.com/opinions/global-opinions/trump-is-spreading-his-fake-news-rhetoric-around-the-world-thats-dangerous/2019/11/19/a7b0a4c6-0af5-11ea-97ac-a7ccc8dd1ebc_story.html

Avoid Groupthink For Better Decision Making

A crowd of people

Groupthink is a psychological phenomenon where a group of people share the same idea/goal/decision, even if it’s irrational or prone to fallacy. This phenomenon may seem like it can only happen in textbooks, clearly with sufficient reasoning by qualified individuals a group would be pursuaded. However, this is something which happens, and an example of such case is the rocket launching of the Challenger in 1986

January 28, 1986, the space shuttle launch day for the Challenger. It was a freezing morning, which would of just been any other day – today was the exception. Engineers of the solid rocket boosters for the Challenger warned NASA flight managers that the O-rings for the boosters aren’t designed for such cold temperatures. However, despite the warning of qualified individuals with solid reasoning, NASA personnels fell victim to groupthink. As a result, they launched as scheduled which resulting in the explosion of the Challenger 73 seconds after liftoff. This is one of many other events.

The graphical representation of groupthink from he wisdom and/or madness of crowds

So now that we have an idea of groupthink, how do we represent this in a graph in a way that it behaves as mentioned above? The representation is actually very simple, as shown in the diagram from “the wisdom and/or madness of crowds“, a game which goes over different topics relationing to the graphical representation of crowds such as the small world and contagions theory.

The spread of information is similar to contagion, however rather than have infection based off of probability, we have it based on the information from neigbhors. As we can see in the model, it is very difficult to convince the group as a single node is only a fraction of the “influence” compared to everyone in the group itself. Taking a look at the model taken from the game, you can see that even if you managed to convince everyone in the group, you are unable to sway the concensus.

Even by convincing everyone (node in blue), it is unable to sway the group (nodes in grey)
References
https://www.forbes.com/sites/forbescoachescouncil/2018/09/18/avoid-groupthink-for-better-decision-making/#7847e24677da

https://www.investopedia.com/terms/g/groupthink.asp

https://ncase.me/crowds/

Using Game Theory for Video Game Design

The process of making a professional video game is a complex task that involves people from many backgrounds to join together and work on something creative. We can examine the ways game theory is used to help make decisions when designing the gameplay as high level decision trees can be made to model the flow and pathways and use payoff matrices to model skill or level change.

There are many methods for design approaches which include flowcharts, storyboards, topological maps, UML and decision trees. Decision trees can be used to model gameplay where different paths in the decision tree relate to different paths that can be chosen by the player or the different outcomes that can arise from the actions of the player. A decision tree is a branching tree style diagram that can show the set of possible actions and decisions that can be made by the player. It can overall model the way the player moves through all the possibilities of the game.

When creating decision trees it is based on the main game interactions of most interest. We can use fixed inanimate objects that will be represented as boxes in the decision tree. The tree will show the likelihood of events occuring, for example for a coin toss game it would show the likelihood of getting heads or tails. In more complex games it would show the probability of getting a success. It would seem too large and out of scale to make a decision tree for the whole game and so instead we can break it into segments or per mission.

The figure represents the design of a simple example of a very small segment of a hypothetical game scenario. It shows the game objects with which the player may interact on how fast and how accurately opponents 1 and 2 will respond.

A payoff matrix can be used to model the player’s decision making the process into a grid structure in order to analyze,document and communicate the skill or challenge levels within the parts of the game. One axis will represent the player’s decision and the other axis of the payoff matrix will represent the opponent’s decisions. It is unfeasible to have a payoff matrix for every possible decision in the game however it’s practical to make one model more generic level decisions made by players given in segments of a game. For example in the video game pong, the accuracy of the movements made by the player affects the game. This is because the ball’s contact with the ping-pong rectangle (bat) returned the ball at smaller angles which made it harder to hit the next time. A payoff matrix can model high and low player accuracy outcomes as generic player decisions. For multiplayer games, statistical analysis of the strategies used by a large number of players via payoff matrices can be used to understand the strategies of the players which will inform us more about the game design. This ultimately can help balance different elements in the game.

Table 1 shows a payoff matrix that could be proposed by a game designer to determine what skill level would be required regarded to the gameplay involving either of the two software-based opponents from Figure 1. In terms of skill level, the matrices could be used to apply Nash equilibrium.

Table 2 shows a payoff matrix based upon an analysis of different games played during playtesting for a given section of a video game. The first number in each cell is the payoff (or probability of success) to the opponent and the second number is the success probability for the player. If they use the same strategy, then the player will win 50% of the time. However if the player chooses a high accuracy/low speed strategy and the opponent chooses a high speed/low accuracy strategy, the player will win 80% of the time. Overall high level payoff matrices can help design the skill and challenge level for different sections of the game.

References

https://journals-sagepub-com.myaccess.library.utoronto.ca/doi/pdf/10.1177/1555412017740497

Game Theory and Self-Driving Cars

Autonomous vehicles have been on the rise from the initial self-parking technology to Tesla and their autopilot mode. Much of this relates to game theory through the choices the AI makes where the AI will assess it’s options and the risk each one has to determine to optimal route to take while ensuring the safety of the driver. An example scenario would be when taking an unprotected left turn, there are two cars, Car B is taking the left turn will Car A is in the opposite lane. If Car A were to keep going then Car B would have to wait until car A passed or risk getting into a car crash with Car B.

Much like how body language can tell you a lot about what a person is thinking and feeling, the way a person drives can also tell a lot about a driver’s attitude. This can be seen from MIT which has released news about heir new AI that observes the driving habits of others on the road to analyze their “driving egotism” so that the AI will know if it should be more assertive or altruistic. This new AI will help to further evolve self-driving cars as they won’t just be reacting to the actions that other drivers are currently taking but also predicting their future actions to determine the best outcome for everyone involved.

The example above shows how the AI will react to two different types of drivers. When facing an egoistic driver like the one from above the AI will choose to wait after choosing the more altruistic option; whereas, when facing a prosocial driver the AI notices that the other driver is slowing down and decides to take the more assertive approach by turning before the other driver passes. This will make the AI appear more human as it will be able to understand the behaviours of other drivers and react accordingly. This is just one of the many scenarios that the AI may have to compute, and with increasing exposure to new scenarios, there will be an improvement to the AI as it will be able to theorize new outcomes thus improving its performance.

References
https://venturebeat.com/2019/11/18/mits-ai-scores-driver-egotism-to-make-autonomous-vehicles-more-assertive/

How to go viral on Twitter

If you are a twitter addict like me, when we tweet something funny or controversial, we believe that our tweet might go viral. But it doesn’t. There are many reasons why this happens. In class, we saw the different ways information can spread and how we can represent that behaviour with trees and measure virality in data.

We can represent all of this by analyzing a viral tweet. We can construct a tree based on a timeline of the number of retweets and likes, and when a specific action caused the tweet to reach out to more people. There are tools like Tweet Reach from Union Metrics that can help, especially businesses, to track these kinds of data to figure out when is the best time to send a tweet and what kind of followers will help to spread the information faster and to a broader audience.

Measuring impressions across a timeline.
Top Retweets can help to see who brought more traffic to the tweet.

A close friend of mine had a tweet go viral a couple of months ago. My idea for this blog was to analyze it using Tweet Reach, but there is no free trial, so I am going to try to break it down just using Twitter Analytics.

https://twitter.com/tyeprincess/status/1154578435450310656

The tweet was sent in July 25th at 10:25 pm and it has caused almost 700K impressions on twitter since. Talking to my friend, she explained that at first, not many people were liking her tweet, but it became viral when one of her followers who has 10K followers herself, retweeted it. As we can see in the graph below, this tweet’s impression increased two days after it was originally tweeted.

After the peak of the tweet which only lasted a couple of days, the tweet went viral again when the blog Narcity did a post about it On August 20th. However, the number of impressions was lower than the original impact. 

Below you can see the summary of total engagements and impressions that this tweet had. The interesting factor about it is the difference between impressions and engagements. Even that the tweet reached out to around 700K people, only around 5% of them either liked, retweeted or replied to the tweet. Spreading information does not mean that the audience will engage with it and will provide any kind of feedback. A piece of information going viral does not guarantee to get the audience’s response.

The question is then, is a viral tweet ranked by the number of engagements or impressions?  I believe it is the number of impressions. If we relate this concept with one of the virality examples we saw in class, we measure virality based on how information can spread out among the population. In other words, what matters is the number of people who received the information rather than the people who provided any response.

If you want to get viral on twitter, you should keep in mind the following:

  1. Be unique: Be funny and/or interesting, those are the best tweets.
  2. Check the time: When is your target audience going to be more active? That’s when you want to shoot your tweet.
  3. (Don’t) Follow trends: Sometimes when you tweet about a controversial or trending topic, your tweet can get lost in between multiple of good tweets, unless it’s REALLY unique. If your tweet is not relevant to the trending topics, you can get more people’s attention.

References:

https://tweetreach.com

https://unionmetrics.com/blog/2016/08/when-a-tweet-goes-viral/

https://analytics.twitter.com/