In the 1999 NBA playoffs, Patrick Ewing, who was a star player that played for the Knicks tore an achilles tendon during the second game of the Eastern finals against Indiana. Despite the unfortunate timing of the event, the Knicks went on to win the next set of games and made it to the finals for the second time in 26 years. How did this happen? Did the Knicks just get lucky? This was the origin of the concept known as “Ewing theory.”
It turns out that many other teams have also had such experiences and it isn’t just limited to basketball. The common observation across such examples is that a team sometimes performs better without their key player. It is a counter intuitive result that is very similar to a topic that we learned in this course, the Braess’ Paradox. The example we studied in class was the fact that sometimes closing major roads helped improve traffic congestion in the area. Is the same phenomenon occurring in Basketball? If so, how can we analyze it?
The paper titled “The Price of Anarchy in Basketball” by Brian Skinner who is a postdoc at MIT, suggests a potential way of studying Basketball offence strategy in a similar manner in which we studied Traffic routing as a game. In the traffic problem, we need to route cars from a source to a destination. In this case, we would try to find an efficient route from initial possession of the ball until a shot is taken. This is shown in the figure below.

The players are the cars and the routes they can take are different plays that they can make and the goal to reach is travelling towards the basket. Finally, the payoff in this model is to maximize the efficiency of the shot. The efficiency of a shot can be thought of as the probability that a shot into the basket is successful. To simplify this problem, the efficiency of the shot is only dependent on who is taking the shot. Another key assumption made in this model is that the more the percentage of shots taken by a single player in a game results in decreasing efficiency which is analogous to more cars on one particular road increasing the congestion of that path. To measure initial efficiency, in this paper, they make use of a well known statistic used in the NBA known as the true shooting percentage, TS% as a measure of the probability of a shot going in depending on which player takes it.
Consider the model below that shows a concrete example of how we can analyze the offensive strategy for a team.

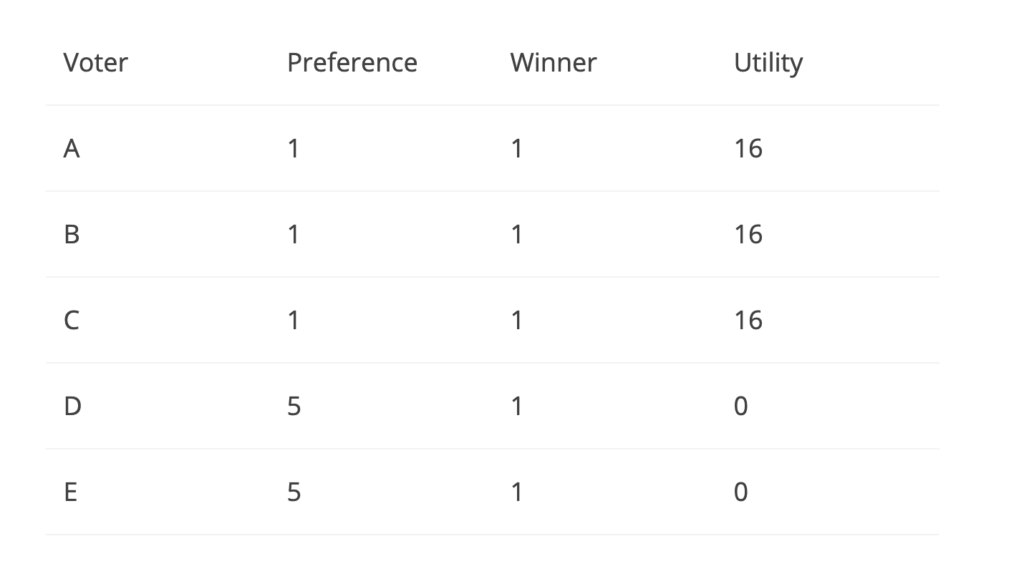
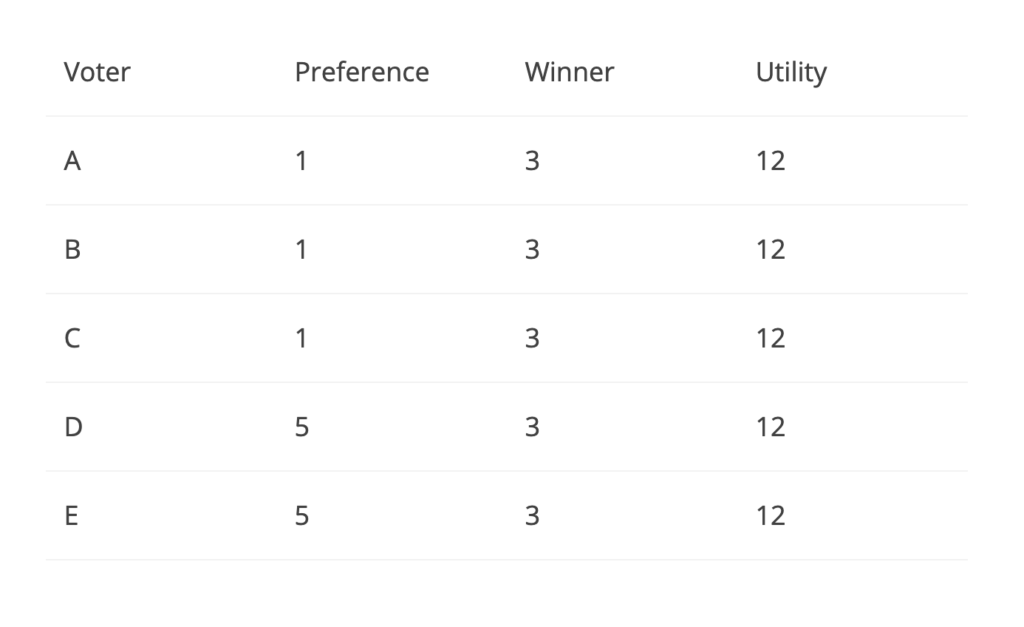
While the paper goes into much more detail on this example, the high level idea can be summarized as follows. Each edge in this network represents the payoff of a decision. The decisions are in this case for player 1 to drive to the net or pass to player 5. The decisions for player 2 are to also drive to the net or pass to player 5. Although this example is different from the traffic routing where every player acted in their best interest to minimize their travel time while here the players are all a part of the same team, there is a different notion of best interest here. The payoffs on the edges represent what each player alone might think is the best decision so we assume that the players act according to their own logic. Furthermore, player 5 in this example can be thought of as a key player in this team. Also, consider the similar model as figure 5 below that has player 5 removed.

Using concepts of Nash equilibrium, the paper computes an overall efficiency at equilibrium of 0.33 while removing the player results in a new equilibrium of 0.375 which is higher than the previous. Player 1 and player 2 now do not have the option to pass to player 5 which limits their choices. This situation is analogous to the improved congestion in traffic when a main node was removed; the Braess’ paradox.
While the model used for analyzing basketball strategy is oversimplified here, as the author of the paper also agrees, it is a good starting point. It also provides some intuition for the improved performance of a sports team when a key player does not play.
Reference List
- Simmons, B. (2001, May 9). Ewing Theory 101. Retrieved from https://www.espn.com/espn/page2/story?page=simmons/010509a.
- Skinner, B. (2010). The price of anarchy in basketball. Journal of Quantitative Analysis in Sports, 6(1).