Game of Thrones –
Network science to find the most important characters
Motivation
I am watching Game of Thrones right now again. The prequel House of the Dragon just dropped, so I’m going to watch both simultaneously.
This got me thinking about ways we can categorize characters, their relationships, and their importance within the show is? Those who watch have their favourite characters, and because of that, they could be biased in deciding on the most important character. Instead, let’s use network science to find the truth and end all the debates. Luckily I found a great case study outlining this and answering all of my questions on this topic.
Research
The research on this topic was done by Eric Ma, a Principal Data Scientist at Moderna. He wrote his analysis of Game of Thrones as a case study for his coursework. He wrote this article and other coursework to give others an intro to graph theory and network science.
Analysis
Game of Thrones has both the TV show and the books, which are very similar. For this analysis, we will be taking a look at the books. Depending on the book (or season), more characters become more prominent, whether it’s because they take on the main character role or previous main characters are no longer in the picture.
To set all of this up, let’s look at the network map of all characters in Game of Thrones’s first book. Very similar to the examples we saw in class as well. Colours categorize strong associations and locations. Basically, many characters of the same colour are generally in the same location because of their strong associations.
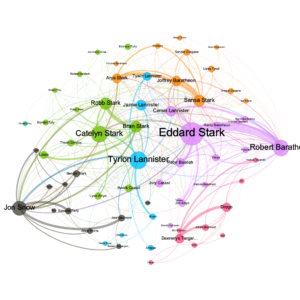
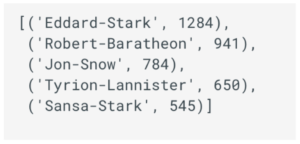
Now given this graph, we can see some of the most important characters in Book 1: Eddard Stark, Tyrion Lannister, Robert Baratheon, Jon Snow, and Catelyn Stark. But how did Eric Ma come to this conclusion? Let’s find out.
First, he created the graph, with the characters having the most interactions and the higher weighted edge. You can see Eddard and Robert have a thick edge because they interact a lot. This is a network science measure of importance called degree centrality. Using this, here are the top 5 most important characters in the first book.

In simple terms, the higher the decimal, the more important the character is. He did this again for characters in the fifth book.
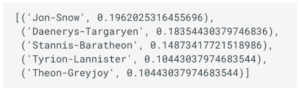
The decimals have dropped significantly, showing that the most important character (Jon Snow) only has a 0.2 measure. Which is exactly what he had in Book 1. What does this mean? I suppose this means side characters are becoming more important, and the main characters interact more with them.
Similar to our distribution example we saw in class, we can see the connectedness of each character in this graph. This graph covers Book 1.
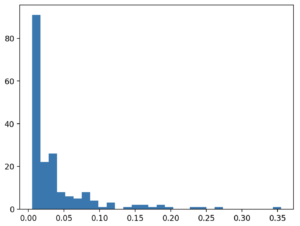
As you can see, we have less important characters and a lot of unimportant characters. This is similar to Instagram there are a few celebrities with a lot of followers, but most people have few followers.
Is there another measure of centrality we can use?
Yes, indeed. Let’s take the weighted degree that Eric used here by taking the sum of each character’s edges to get the most important character. Again the results were the same
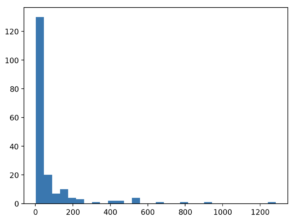
Same result, a different measure of importance.
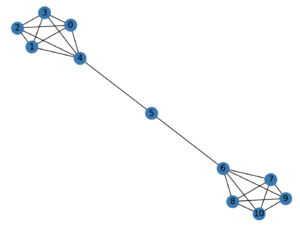
Bridge Edges
In our lecture, a bridge edge is defined as an edge that, if it is removed it will disconnect the graph. Eric Ma has found Stannis Baratheon as a perfect example of this in the books. Although this graph isn’t actually from the Game of Thrones characters, Eric uses it to represent the situation. In the graph below, Stannis Baratheon would represent node 5. This means Stannis is a bridge edge; without him, both groups would not know each other.
Conclusion
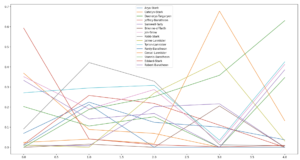
Those who like Game of Thrones have their own favourite characters, and that may cause fans not to be objective in their opinions. We may be biased when deciding who is the most important character. Through computer and network science, we can find concrete evidence on who the most important characters are, putting an end to all the debates you and your friends have. Basically, if you were right according to this data, you have bragging rights now. Here is a great graph showing the most popular characters at any given point in Books 1-5.
Source
Ma, Eric. (n.d.). Network Analysis Made Simple – Chapter 12: Game of Thrones. Network Analysis Made Simple. https://ericmjl.github.io/Network-Analysis-Made-Simple/05-casestudies/01-gameofthrones/