Introduction and Motivation
The first ever wristwatch was said to have been made over two centuries ago in 1810. Over these past couple of centuries, the purpose of watches has changed dramatically. They started off as a tool for militaries that made it easier for everyone to coordinate strategic moves accurately, with the wristwatch being a big step up in convenience when compared to a pocket watch, especially during crucial times like in a battle. As time went on, they became more accessible and widely adopted by the general public. Over time, wristwatch technology advanced significantly, resulting in specialized watches being purposefully built for different use cases, such as pilot’s watches and diver’s watches. After the wars and especially in the most recent decades, watches made their way from being timing tools to becoming highly desired luxury goods. Recently, mechanical watches have exploded in popularity despite their purposes being obsolete with the mass adoption of the smartphone. As for luxury watches, the demand for many models has substantially outgrown the supply causing a massive increase in prices with some of the most sought after pieces trading in the secondary market for multiple times their retail price. Most of these watch producers, especially in the luxury segment, are clustered in a few countries. This raises the question: how do these watch producers expand their brands internationally? In particular, how do watches go from a few countries to the hands of consumers who are located all around the world? This is especially interesting for the luxury market, where producers will not ship directly to consumers and cannot open a boutique in every city around the world. By taking a network science approach to analyze the distribution of watches, we can identify how these timepieces go from producers to end-markets, and ultimately, the existence and importance of intermediary hubs.
Data and Network Analysis
In 2017, Pierre-Yves Donzé published a paper analyzing the global distribution of watches. He used data on exports and imports of watches between countries for his analysis. A trade matrix is created using trade values between an exporting country and an importing country, where trade value is calculated using the average of the export value reported by the exporter and the import value reported by the importer (see fig. 1). The matrix maps the exporting country to the importing country with value as the trade value calculated. He converts the trade matrix into a graph to represent the data and conduct network analysis. Countries are converted to nodes, and trade values are converted to weighted links. The three criteria used to examine nodes are degree, strength, and clustering coefficient. The first and last are calculated the same as we have done in this course, and the strength is calculated by taking the sum of the weights of the node’s links. He observes that the average degree is very high, almost equal to the number of nodes, and the clustering coefficient is high for all nodes. This tells us that the graph is very dense and that each node is connected to almost all other nodes. The strength of the nodes varied quite a bit, and these show us how important each node is within the distribution network. The issue with this representation of the network is that the graph is too dense and does not provide much insight.
Network Visualization
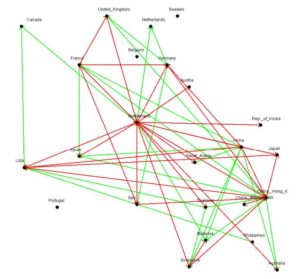
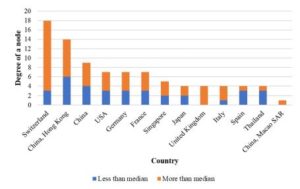
To provide more insight and allow better visualization of the network, the number of links need to be reduced so that only the significant links are left. To do so, Donzé retains the links with weights above a certain threshold. The graph created by this new set of links is much more interesting (see fig. 2). In the graph, links are shown in two colours; the red links represent the one in the upper half of trade values and green links represent the lower half. In other words, the red links are the most significant export-import relationships. The graph visually shows the countries and where the highest trade value links are, thus exposing which countries the intermediary hubs for distribution are; the intermediary hubs are the nodes with the most links, or highest degree, especially nodes with many red links. Donzé also constructs a chart to numerically display the number of links of each node (see fig. 3). The orange in the chart represents the red links in the graph and the blue represents the green links.
Conclusions
Looking at the previously mentioned graph and chart, we observe that the node with the most links is Switzerland, which should be no surprise since it’s the country with the highest luxury watch production and also the greatest value of watch exports. Its links are connected to both countries that are end-consumers and countries that are major distribution hubs, as expected for being the top producer. The node with the second most links is Hong Kong, which is connected to many countries in Asia. However, they do not produce watches, which leads to the conclusion that Hong Kong is a very significant intermediary distribution hub for watch producers to reach markets globally. In third place is China, which is linked to many markets globally as both a watch producer (though not luxury) and distribution hub. Qualitatively, we see that there are indeed several intermediary hubs that aid watch producers in global distribution. Overall, the analysis with a network science approach shows that these intermediary hubs play a key role in distributing watches from producers to local markets globally, especially since producers do not export directly to all local markets.
Sources
Donzé, P.-Y. (2017, November). Global distribution of watches: A network analysis of trade relations. Retrieved from https://www.researchgate.net/publication/321896257_Global_Distribution_of_Watches_A_Network_Analysis_of_Trade_Relations