Introduction:
Have you ever wondered how companies, like LinkedIn, test new features to their platform before releasing them for the public? Does this new feature correctly perform the task it is made to do? How do they know if people would like this new feature over other features? At LinkedIn, most of these questions are answered through a form of testing known as A/B testing. A/B testing involves two features, A and B, which in essence fight each other to be crowned the best feature out of the two. It involves giving feature A to a random set of uses, and feature B to another set. The sets of users are then compared by determining which set of users had a better experience with the feature. Although this may sound straightforward, it is everything but that when dealing with a vast social network such as LinkedIn. The key problem here is the assumption that the set of users chosen to receive feature A has no effect on the set of users chosen for feature B and vice versa. This is commonly known as the “Network Effect”, an interference during A/B testing. The problem arises from the fact that users in one set might have connections with users in another set, and performing experiments on one set of users can have an effect on the users of another set which effectively skews up the results of A/B tests.
Motivation:
The reason I have chosen to speak on this topic is because it shows the issue of how small changes in a large network have noticeable effects on the entire network due to clustering and connectivity of the network. This article shows how the big company LinkedIn detects these effects on the network in order to determine how biased results are when doing feature testing, which can lead the company to making wrong decisions. This topic is related to many topics discussed in class, such as the topic of Graph Theory itself, Strongly Connected Components and how the structure of networks tend to be one big SCC, and node clustering in large social networks. This is related to SCCs as it shows how small effects in a network can affect the entire network due to conduciveness of the network, and it is related to node clustering as discussed in class as the approach taken to detect Network Effects make use of Ego clusters in a social network.
So, how does LinkedIn detect Network Effects:
Detecting Network Effects can be done in 4 steps:
- Using LinkedIn members as nodes and their connections with other users as edges, create 10000 ego clusters from the LinkedIn graph.
- Take half of the clusters and perform two parallel experiments:
- In one half, disregard the clusters and the connection between the nodes. In essence, perform the normal A/B test where we do not care if the results are skewed due to influence of the set of users selected to receive feature A on the set of users selected to feature B.
- On the other half, we use the ego clusters where we choose entire communities to receive feature A and another community to receive feature B
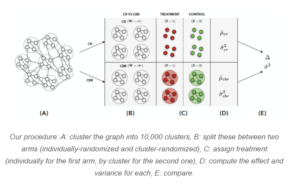
The idea behind this is that Experiment A will be the normal experiment that has potential Network Effects. Experiment B where A/B testing was conducted on communities rather than individuals, the Network Effect will be much lower than Experiment A. This is because there is a much lower chance effects of feature A testing on a community will have an influence on other communities since people across communities have less connections with each other. Once these two experiments are conducted, they can be compared to detect the presence of the Network Effect. If the two experiments give the same results, then there is no Network Effect.
What are the results on the LinkedIn network:
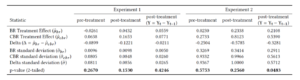
The first row and second row of the table show the results of Experiment A and Experiment B respectively, while the third row compares the two. The results of the experiments are given on the second to last column of the table where the results are the computed results of the A/B tests for each of the experiments. From the table, we see that the effect measured by Experiment A is about 0.24 while the effect measured by Experiment B is about 0.81. We know that if there is no Network Effect, these results should be close to equal. So, we can conclude there is a clear Network Effect for this A/B test.
Conclusion:
This test to detect Network Effects can be performed on many other social media graphs. The result of this test can be used to decide if a certain feature requires special treatment when doing A/B testing so we can get a less biased effect of the feature.
Sources
Detecting interference: An A/B test of A/B tests. LinkedIn Engineering. (n.d.). Retrieved October 7, 2022, from https://engineering.linkedin.com/blog/2019/06/detecting-interference–an-a-b-test-of-a-b-tests
Using ego-clusters to measure network effects at linkedin – arxiv. (n.d.). Retrieved October 7, 2022, from https://arxiv.org/pdf/1903.08755.pdf