Introduction
The year is 2035, you’ve just purchased your forever home and want to fill it with cool cutting edge smart tech. However, you’re not safe, there is a danger looming over the horizon (or more like over the internet). More specifically, your home could be hit with DDoS attack, flooding your systems with requests and leaving you vulnerable, but don’t worry, graph theory can save you. By analyzing the paper “Detecting DoS Attack in Smart Home IoT Devices Using a Graph-Based Approach”, we look at one way to better monitor the safety of your smart home.
How do graphs help?
With graphs we can abstract the representation of a IoT network which inherently has many natural relationships between devices. Through multiple captures of these devices as graphs, we can actively monitor for suspicious behaviour. We do not require any other information apart from IP source and destination to monitor the amount of traffic from one device to another as an edge. Then we can create a graph stream of the normal traffic patterns exhibited by a functioning system. If there were a deviation from this pattern then that would be a red flag that there could be something wrong.
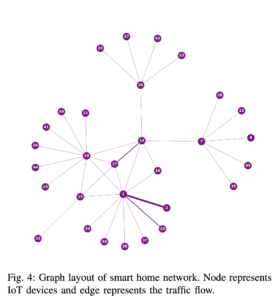
As mentioned above, each node represents some IoT device (smart fridge, smart outlet, RGB light bulbs, smart thermostat) any device that can exchange information digitally over some connection like the internet or bluetooth. Each undirected edge represents interaction between two IoT devices, where the weight of an edge is the count of how many times these two devices exchange information within an interval of time .
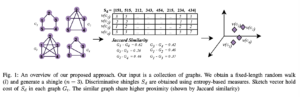
To build a graph stream, the monitoring system would capture multiple graphs of the IoT devices interactions every minute. From each graph, we generate a shingle vector that represents a graphs local graph structure and edge order, which we can use to compare against previous shingle vectors to determine the similarity to previous graphs.
A shingle vector can capture the structure of the graph by incorporating neighbouring hood sampling in its generation. Breadth first search is performed to understand the structure of the local group and depth first search to understand the global shape of the graph. It is important to have an understanding of the local neighbourhood because in the case of DoS attack we can identify immediate device groups that are vulnerable.
When a DDoS attack occurs, the IoT system is flooded with requests causing an edge(s) weight to increase significantly which would vastly alter a shingle vector, thus leading to a detection of an anomaly in the monitoring system.
Conclusion
It is extremely interesting to see the wide range of use cases for graph theory, especially applied to monitoring the safety of your home devices. The proposed concept outlined by the paper provides an efficient and scalable monitoring system that uses the power of graph theory.
SOURCE:
Paudel, Ramesh & Muncy, Timothy & Eberle, William. (2019). Detecting DoS Attack in Smart Home IoT Devices Using a Graph-Based Approach. 10.1109/BigData47090.2019.9006156.
One reply on “How Graph Theory could protect your home”
This is a very interesting topic of the case where a theoretical portion of computer science comes to life and helps us in the real world in our day to day lives. Great post! Clearly thought out and relevant to the course content.