Introduction
The game of chess as a whole has been studied for centuries before the introduction of computer chess engines. Ever since computer chess engines have proven to become stronger than even the top human chess players in the 1996 Deep Blue v. Kasparov match, there have been incremental discoveries and shifts in the best openings and structures in the game. In an article by Daniel Sharp titled “How To Analyse Chess Games Using Graph Networks”, he analyzes some intriguing patterns.
The Results?
The one constant in chess is that each game starts in the exact configuration. As such, many patterns can be analyzed through creating a network of the first (insert arbitrary number) of moves played and how often certain pairs of moves appear in the same game.
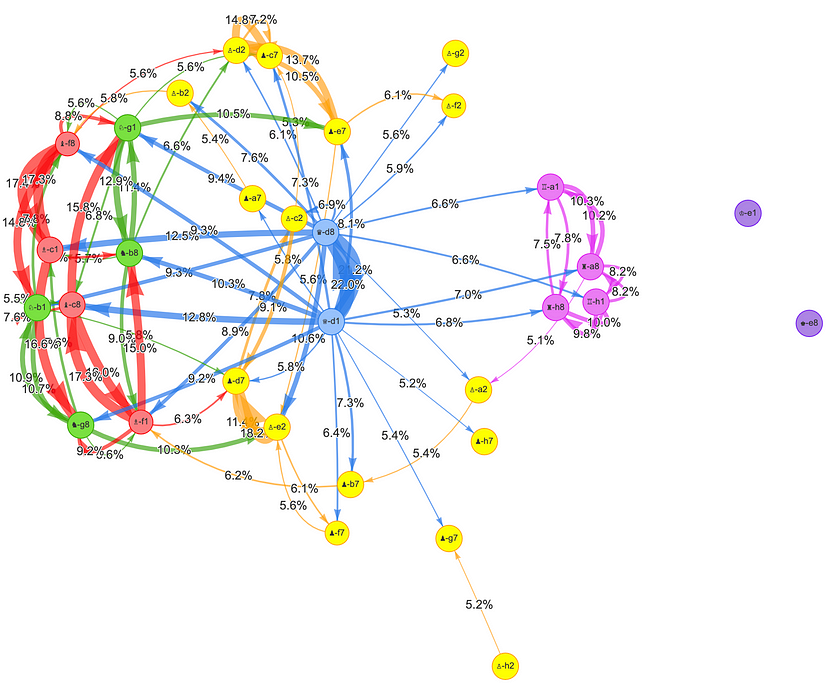
The above directed network graph shows each chess piece as a node, based on their starting position. This means that there is one node representing the king and queen, two nodes for each of the knights, bishops, and rooks, and eight for the pawns. Each directed edge A-B between each node represents a game where A captured B. The weighting of each node is based on degree centrality, which is the number of edges attached to the given node. This means that for a given node A, the wider range of various pieces and more frequent capture of pieces A has, the more weighting it has.
The network above attempts to convey the “importance” of each piece. The more a piece is used to capture other pieces, the more important it is for it to stay in the game. At no surprise, the queens on both sides of the board is the largest node, followed by f1, f8, and c1 bishop. Of course, the number of captures is a poor measure for importance but it still tells us a lot about how the games are usually played out.
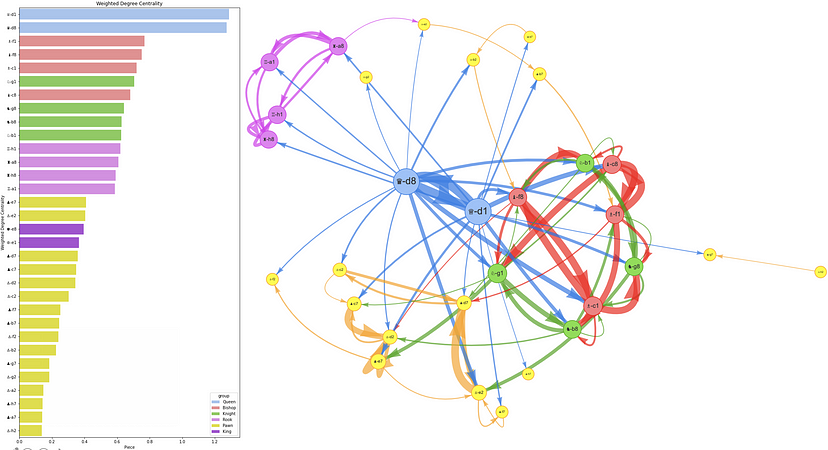
Another beautiful network graph from Daniel’s article shows the nodes as each individual piece (the same as the prior graph). This time, the edges represent the frequency of captures each piece makes in the games analyzed. The colored nodes and edges are done in a way to represent communities of pieces based on the weighting of the edges.
The communities tell us how frequently pieces in the community are to trade or capture with each other. For example, community 0 with the a1 rook and the a8 rook may imply that these rooks often are traded. This tells us some hilarious facts about which pieces are often traded which tells us a lot about openings. Because many openings are theoretical, some trades are forced to happen which is reflected in these communities.
Conclusion
Using network graphs to analyze chess games is not common. Most chess engines and openings exploration databases are stored as trees where each move made is equivalent to a layer in the tree. These network graphs help to explore relationships regardless of move order. But alas, do these analyses affect the way top players play? Maybe, but probably not. But does it help satisfy our curiosity and to help understand the game better? Absolutely, and I’d say that is pretty important.
One reply on “Chess and Networks? 🤯”
As a chess player myself, I find this topic very interesting. I have always thought about the methods of analysis and chess engines and how they worked. Although this is not a conventional means of analysis of chess games, this gives me at least some kind of insight into how it can be done.