Introduction
O’Neill et al. (2016) chose to investigate the Steam gaming platform for several reasons. For context, Steam is the largest PC gaming platform that is feature rich with a robust store feature, friends, discussion forums, and achievements to name a few. One of the interesting features of the study was that choosing Steam not only allows for the researchers to analyze game purchasing information but also, the study covers a large spectrum of gamers that play many genres. This was done instead of analyzing user behavior in a specific game which may fall to possible biases inherent to the specific game.
Research was conducted on the figures received from the Steam api and fascinatingly, many of the figures measured follow a Power Law distribution. We can see many long tailed graphs used to analyze many varieties of behavior within Steam gamers.
Analysis
One of the more unsurprising findings was that the number of friends that a user has in Steam, the degree of the node in the undirected graph of friend nodes, follows a Power Law distribution.
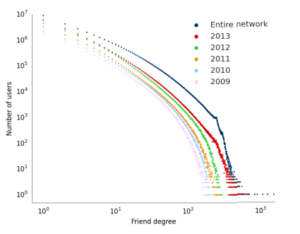
Just like in class, we see that on a log log scale, the graph above approaches linearity. This is as expected as friend networks are known to follow this distribution as we’ve learned.
As we continue to look at other figures from the measurement study, consider the following graphic from class about long (heavy) tail graphs:
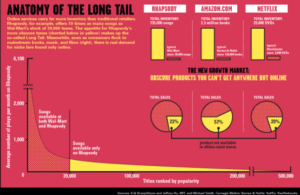
The saliant point is that there is a niche yet real and substantial demand for more obscure products found online.
This can help us characterize and understand much of the gamer behavior we are about to see. There is a real demand for niche games and perfecting games whether it be through mastery of mechanics through hours played or achievement completion.
Speaking of niche interests, there are also a small but substantial amount of users that collect games and are willing to try many games. We see these heavy tail users demonstrated in these findings:
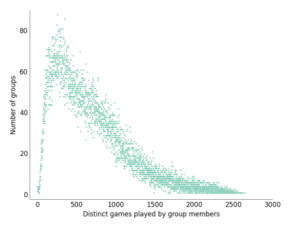
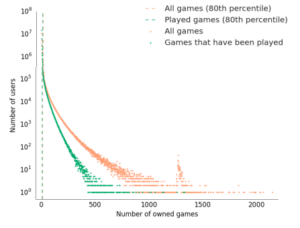
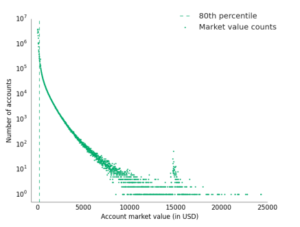
From these three graphs, we can see that there are a substantial number of users that purchase and play many games which results in a large account market value. Although most players generally play a very few number of games, this indie (independant) games are still able to find success. These games tend to be made by very small teams but it tends to be these types of users that are willing to explore and try many new titles that allow those games to succeed. This is a point that I feel personally strong about since I have a great fondness for the variety of gameplay and design that is often seen in indie titles.
Moving onto hours played, we can also see a heavy tail as some users are able to pour most of their time into games. These people can possibly be streamers, students with lots of free time, or gaming addicts. 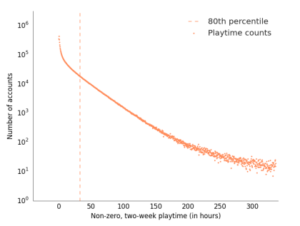
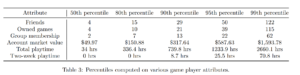
I chose to write about this topic as I am a very active Steam user myself and was much more active when I had much more free time during high school. Looking back and comparing to the findings of this paper, I think I would definitely be considered 95th – 99th percentile in some of these measurements during my most active years. For example, there was a time when I was averaging around 40h of playtime in two weeks with 100+ friends and 100+ owned games.
Conclusion
By analyzing gamer behavior from the largest PC gaming platform, we can get a better look into consumer behavior to help better predict market trends but also, this research can help us understand phenomena surrounding gaming culture.
It can help us understand gaming addiction. Maybe specific genres are more prone to be played by gaming addicts? Could there be a causation relation with MMORPGS? Is financial burden an issue for gaming addicts? The research conducted on Steam account values can help us understand this.
We can also address stereotypes. From the research, we know that 90th percentile of players play roughly just over half an hour per day which is far less time than the stereotype of a gamer would portray.
Future research may be able to address any potential ‘rich get richer’ phenomena going on in data observed in this study. Is is not clearly evident if it exists but it might as we are dealing with Power Law and heavy-tailed graphs. Maybe there could be something non-independent that underpins a specific users playtime.
Source
https://internet.byu.edu/static/papers/steam-imc-2016.pdf
2 replies on “Analyzing Steam Gamer Behavior Using Power Laws”
Super interesting how you tied power laws into all aspects of streaming, from number of users who play/purchase a game to number of friends a user will have in a stream. Also liked how you averaged 40h of playtime in 2 weeks and glad to know I am not the only one 🙂
As a fellow gamer, i found your post really interesting. I wonder if we can leverage any of your findings from using the power law in a practical sense. Perhaps by understanding these “open minded” gamers better a developer could drive more of the market to try their game