Introduction
There are, of course, various blessings and curses associated with the current “Age of Information.” The internet makes information retrieval seem a rather primitive task, but it is certainly no longer as easy as it was decades ago to contribute meaningfully to the network of information as it has grown to a gargantuan size. That is, the probability of the network(s) not containing a piece of information, or a particular node, keeps becoming increasingly unlikely with time. However, the blessing here is that while the network has grown, the methods of analysis of these networks have also advanced alongside them. For example, corporations can use analysis of proprietary, or public information networks to further the success of their operations in various ways. One form of analysis which proves to be quite useful in the modern day is the usage of recommendation graphs.
Product Recommendations
The best example of the application of recommendation graphs is when they are used to recommend products. For instance, e-commerce sites such as Amazon recommend their customers similar products as the ones they are currently viewing, have in their cart, or have previously bought. Brick-and-mortar stores do similar things, and have done so before the internet revolution. From the salesman recommending shoe polish for new shoes, to something more subtle such as placing the baby clothes and stroller sections next to each other. Before the advent of recommendation networks on e-commerce platforms, it was up to the customer to order similar products. Often times, they will close their computer after purchasing a single item, or may not even know about other relevant ones, which meant that there was some revenue being lost for the platform.
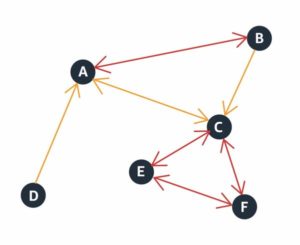
A sample product recommendation network. Orange edges represent products purchased together. Red edges represent similarity between products. A directed orange edge means purchases of the first product lead to purchases of the second more often, but not the other way around (e.g. new phone leads to phone case purchase more often than the other way around).
Graphs are the best choice to hold a recommendation system as we will need to represent many different kinds of relationships. Not to mention, they inherently provide a large number of angles for analysis of the information contained within them. Assuming the only data we have is what we have collected on customer purchase habits (and did not influence the graph with any other knowledge about the system we may already possess):
- Directions: We can recommend a creative software suite (e.g. Adobe) to purchasers of a computer designed for creative professionals (e.g. Mac Studio), but probably not the other way around. Our graph will have edges which are directed (but not all of them, some things do just go together).
- Weights: Maybe we could refine our recommendation system by reinforcing edges between related products and assigning appropriate weights. A few customers purchasing paper and tape together shouldn’t immediately imply recommending tape to everyone who purchases paper or paper to everyone who purchases tape.
- Paths: We could follow the paths in our network and keep recommending products one click after another, because we are looking to maximize revenue. Cycles should be avoided, for obvious, silly reasons. We should also not get carried away and skip from the start of the path to the end as the customer may be more than slightly confused of the connection.
- Triadic Closure: Instead of only basing our predictions off of customer purchase data, we could make our own predictions as well (using only the information about and properties of the graph at hand, and nothing else). We may see that customers tend to buy cases and screen protectors to go with their new phones; these are two directed edges from the phone to each accessory. We know it would be odd to recommend a phone to someone looking at an accessory, but what if we recommend a screen protector to someone looking at a case? Thus, closing the triangle (with an undirected edge, so we could recommend both ways). They may then decide to replace their old broken screen protector. This would require categorization of what is the primary product and what its accessories are, so we may ensure the third edge is between accessories.
Extending recommendation networks
Recommendation networks are present within many platforms, with the most common use case in e-commerce. These applications all make sense, and have become crucial parts of the operations of their respective platforms. Surely for something so effective, there have to be other areas which we could apply them?
Tracking immigration patterns provides another use of recommendation networks.

Above is the flow of migrants from one province to another. We can see that top destinations for Ontarians are B.C., Alberta, and Quebec, in that order. There is likely a reason for this, but there is not much data to form a robust recommendation system from. However, this is a good starting point, from where we can look at related, but more interesting data sets.
Although the data is not easily made available, one usage would be to recommend cities people may want to move to. If one feels it’s time for a change, they may be interested in a city recommendation; suggesting a city they may like to live in based on their current city. We would accrue the data for this recommendation system over time by analyzing the migration patterns between cities, and refining our recommendations using the same techniques described earlier.
- Directions: There are many metropolitan hotspots that a lot of people aspire to move to, so we will likely have a lot of directed edges pointing from more rural or quieter areas to said hotspots (e.g. Toronto, Vancouver, New York). These hotspots would also potentially have undirected edges between them to represent people’s movement and their similarity.
- Weights: Edges would have weights to account for the magnitude of movement. Metropolitan areas would likely have heavier in-edges. We would take into account the weights of edges when making our top recommendations.
- Paths: We would record data of the chain of migration of people that started at a particular city. We could then also put other people onto the path. Cycles would be fine in this case (Welcome back!).
- Triadic Closure: If lots of people are moving from Paris to Milan and from Paris to Vienna, but not many are moving between Milan and Vienna, we could insert an undirected edge on our own and start making a recommendation on the basis of triadic closure. We do this as we hypothesize that Milan and Vienna could be similar (without visiting either). This first iteration of the logic is quite rudimentary, and requires more parameters and cautiousness when closing triangles. We would want to ensure there is nothing else at play, that perhaps it is two large groups of people with different needs or wants and there is a split. This would be bad, as it would mean Milan and Vienna are both popular destinations for Parisians, but are actually quite different and appeal to different kinds of people. To correct this, we would need more data, such as reason for moving, and close triangles if reasons align.
Conclusion
Information not analysed and capitalised on is information wasted. Graphs/Networks make analysis of information very useful in identifying connections. Extrapolating information using various techniques is key in the age of information, and has benefits in many fields. Understanding and utilizing evolving recommendation networks can be crucial in identifying behaviours and tendencies, as well as forecasting ones of the future.
References
- Virinchi, S. (2022, October 11). Using graph neural networks to recommend related products. Amazon Science. Amazon Science. https://www.amazon.science/blog/using-graph-neural-networks-to-recommend-related-products. Accessed 19 October 2022
- Chastko, K. (2021, July 14). Report on the demographic situation in Canada internal migration: Overview, 2016/2017 to 2018/2019. Internal migration: Overview, 2016/2017 to 2018/2019. Government of Canada. https://www150.statcan.gc.ca/n1/pub/91-209-x/2021001/article/00001-eng.htm. Accessed 19 October 2022