An Exploration of Graph Clustering Algorithms
Introduction:
Ever since the topic of graph clustering has been brought up in class, I have been deeply intrigued by the concept. My mind was swimming with ideas for other possible clustering algorithms and how to measure the quality of a clustering algorithm. Then clustering was mentioned in another course of mine, CSCC11(machine learning). This is hat initiated my deep dive. We learned k-means (and k-medians to lesser extent) clustering. I want to see if this type of algorithm was applied to a social network. Through my spiral into this topic, i found a few articles that i found particularly interesting that i will discuss here.
YWorks:
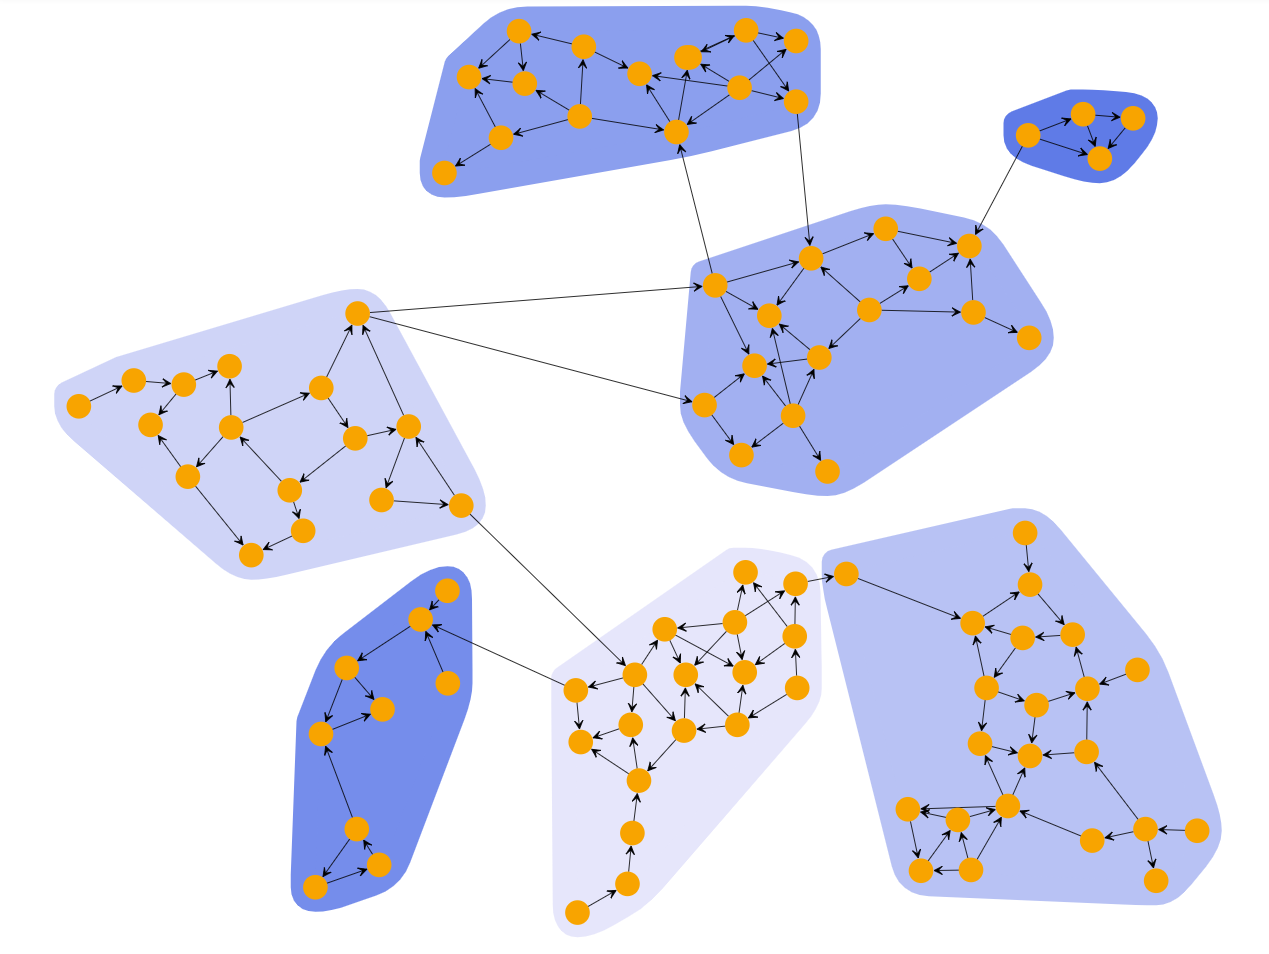
YWorks is a data visualizing and a data science company that specializes in diagramming. I wound this to be an excellent application of clustering algorithms and a application based approach on the practicality of clustering. YWorks offers 4 main algorithm, 2 are topology based (based on properties of the graph itself) and 2 are distance based

Topology based:
Edge Betweeness: This is the algorithm discussed in class, although slightly more complex as it handles weighted edges as well. I wont be going into much detail about this one as everyone should already be familiar with this
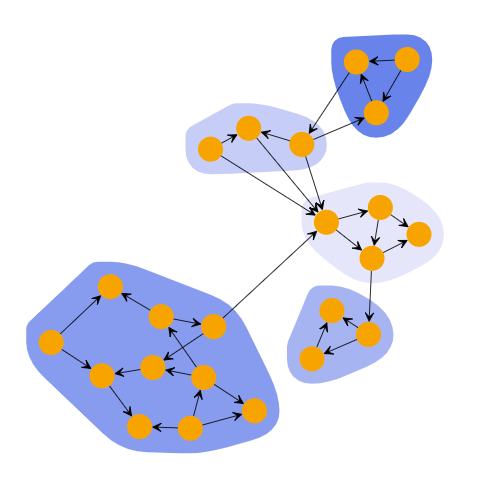
Biconnected Components: This is a different approach to clustering. This algorithm takes each biconnected component as its own cluster. A biconnected component is a connected component such that removing any single node keeps the component connected. Basically every component has redundancy. The algorithm takes each node and puts it into its biconnected component. If a node has multiple biconnected component, one is uniformly chosen. This type of graph is really important in terms of information network because of the redundancy present in each cluster. For example, if we applied this algorithm on a network of routers, we would want to ensure there is at least one access point in every cluster.
distance based:
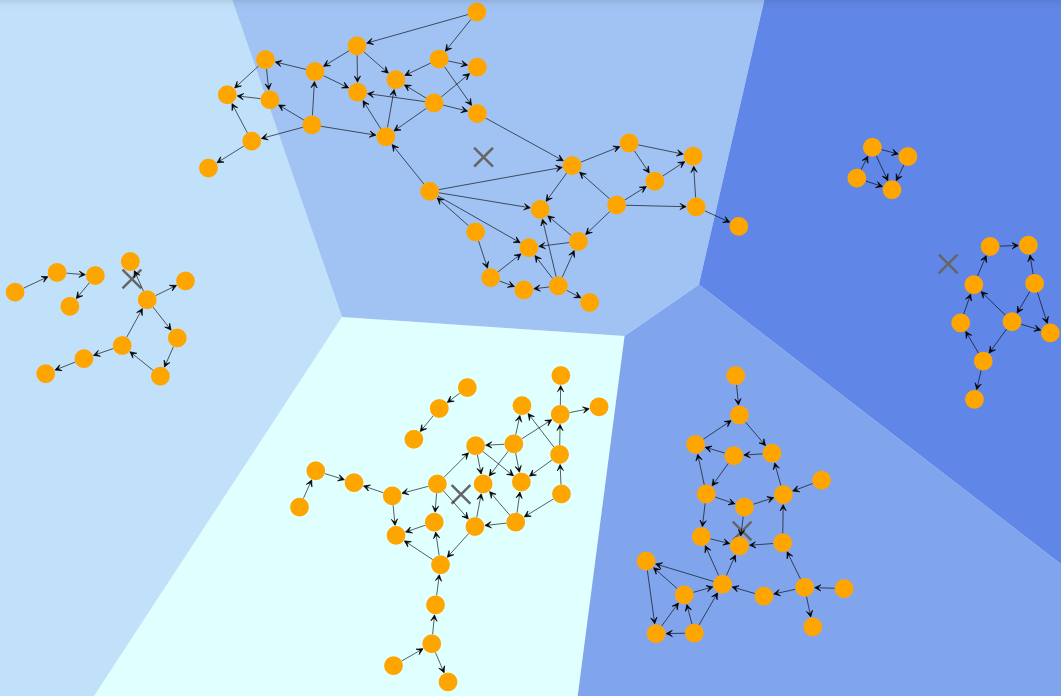
K-Means: This is the algorithm i first heard discussed in CSCC11. This algorithm uses k centroids and creates clusters that minimize distance to the centroids. It is an iterative algorithm that chooses centroid locations, checks the distance, then updates the centroid locations to minimize the distance. There is a whole art to choosing the initial locations of the centroids, or even the number of centroids. There are variants to K-Means that better suit other situations. There is recursive K-Means that creates an hierarchical clustering using k-means recursively. There is k-medians when the median distance is optimized instead of mean distance. There is enough information in the K-means rabbit hole for its own blog post
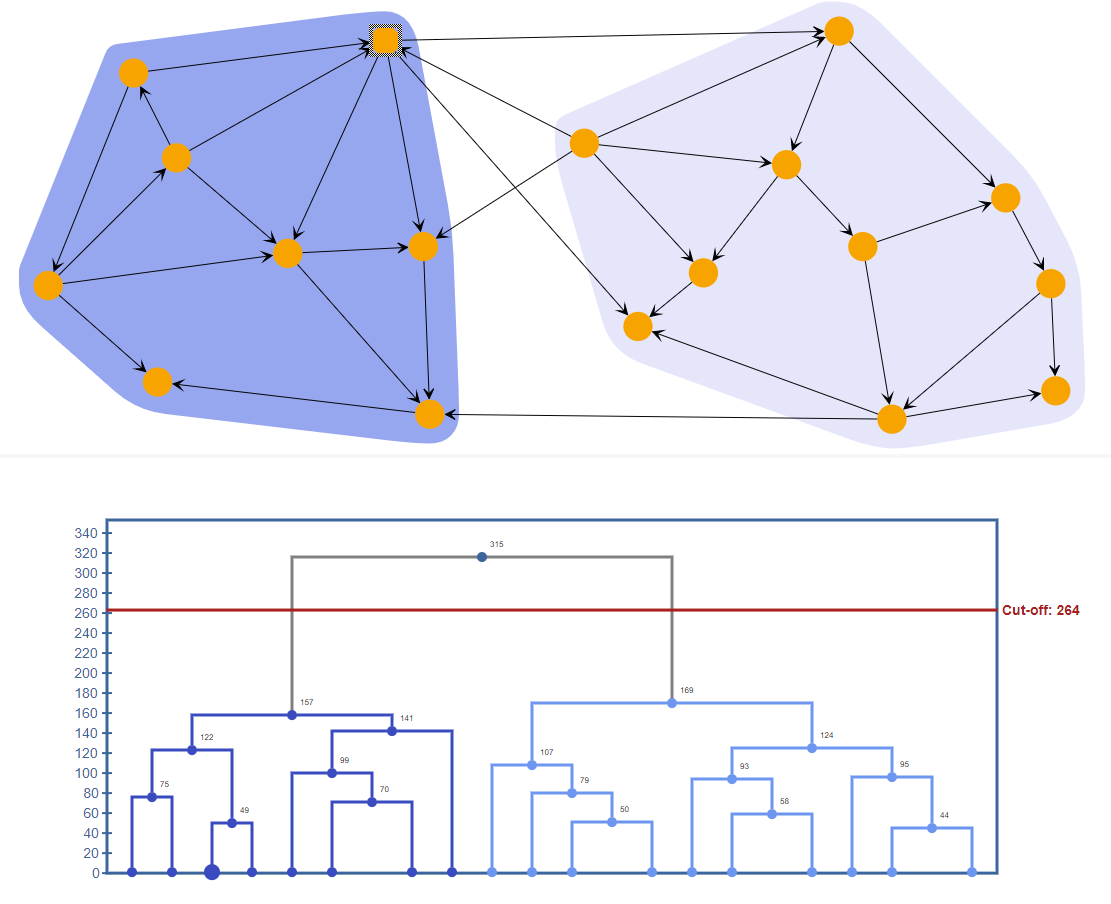
Hierarchical Agglomeration: As the name implies, this is a hierarchical clustering algorithm. It starts with each node as its own cluster. Then it merges the 2 closes clusters together. This is done recursively until all the clusters are formed. This is a simpler algorithm, and as a by product of that simplicity, its time complexity goes up. this takes O(n^3) time and O(n^2) space complexity. Its high time and space requirements lead it to not be used too often
Analysis of Algorithms at Scale
Now I’m going to refer to an article I read that measure 4 algorithms based on metrics and provide statistics relevant to each algorithm. I felt that it was necessary to show that there isn’t a general “best algorithm” and that each algorithm is context specific. They run each algorithm on both synthesized graphs, and graphs formed based on real world data. They judged the qualities of the clusters based on 3 values; Modularity, Conductance, and Coverage. These terms all have a rigorous mathematical definition that you can look at. I tried to define them in pure English in my original draft of this blog post but decided to cut them because they are too complex. The 4 algorithms they use are Louvain, Infomap, Label Propagation, and Smart Local Moving. These algorithms are very interesting but a bit too complex to explain in this blog post. If any of you are interested (if there is anyone other then the TA reading this of course), I would highly recommend looking into these.
Louvain: This algorithm, in high level terms, aims to maximize the modularity of each node. This algorithm is known to be NP-hard, thus not the most time efficient algorithm. This algorithm performed well. Surprisingly so, as this paper had found contradictory results to a previous one. This algorithm placed 2nd overall, barely edging out third place
Infomap: Infomap uses complicated information theory to cluster the graph. Infomap uses an approximation algorithm that works extremely efficiently. It been shown to be stable even ad 100 000 nodes. This algorithm place 3rd overall, losing out to the surprising result of Louvain. There were previous papers that had tested these 2 algorithms and had seen Infomap the be the better of the 2.
Label Propagation: Label Propagation (LP) is an iterative process in which a label is assigned to each node. Then, through a series of iterations, labels are propagated out until they converge into clusters. This algorithm did the worst out of the 4. The authors claim LP is not very good ad weakly defined clusters, but it scales well to bigger graphs with well defined labels.
Smart Local Moving (SLM): SLM is another algorithm that aims to maximize modularity. SLM builds on Louvain by introducing a dynamic objective function. This placed first out of all the algorithms tested. The authors actively refrain from claiming it the best algorithm as they had noticed some discrepancies with the parameters.
These rankings are to be taken with a huge grain of salt. Firstly, all these metrics were arbitrarily chosen, and the authors claim that some of them might not be the best to test quality. Secondly, the authors notice huge variance in some cases or discrepancies in the data. This article clearly has definitively proven a best algorithm, not even close. What it has done, however, is plotted a couple more data points in the area, and we can only improve as we get more data.
Conclusion:
So this has been my little adventure with exploring clustering algorithms. This has been but a glimpse into this immense topic int computer science. I have loads more to look into and I will continue to better understand this topic. I hope that you found at least one interesting thing in this post. If not, I this has inspired you to go on your own little adventure.
References:
Emmons, Scott, et al. “Analysis of Network Clustering Algorithms and Cluster Quality Metrics at Scale.” PLOS ONE, vol. 11, no. 7, 2016, https://doi.org/10.1371/journal.pone.0159161.
yWorks, the diagramming company. “Clustering Graphs and Networks.” YWorks, the Diagramming Experts, https://www.yworks.com/pages/clustering-graphs-and-networks.