Introduction
With the development of the world’s economies, the population moving to central cities increasing during past decades, which imposes significant pressure on urban traffic. The underground railway, an important role in diverting ground traffic was rapidly established. However, disruption, signal failures, and station cut-offs frequently impact the underground network service and cause trouble for commuters. Therefore, using mathematical approaches to examine the network’s quality and vulnerability, and used for planning, prediction, and resource adjustment becomes an important topic in underground network maintenance.
Graph Representation of Underground Network
Consider the underground network as an undirected graph, where each vertex represents a station and each edge is the rail connection between two stations.
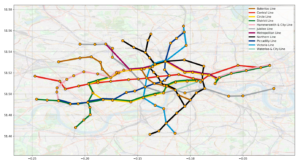
Graph 1: Graph representation of the London underground network
Measuring Centrality and Vulnerability
Betweenness centrality, which is a measure of centrality in a graph based on shortest paths, represents the degree to which nodes stand between each other. In the underground network, it reflects the extent to which a vertex (station) is an intermediate in the communication over the graph (underground network). For example, a station with higher betweenness centrality means more underground lines will pass through that station.
Calculating the betweenness centrality will allow us to measure the vulnerability of a station when traffic disruptions. The center stations show a more significant betweenness centrality, while outer area stations have a smaller value, which means the cut-off of the station with higher betweenness centrality will cause less impact since people can easily access alternative stations which are connected to underground lines. Correspondingly, disruption of the low centrality station will cause more serious implications as it will cut-off further access to the outer area network since some underground lines may only be connected to this station.
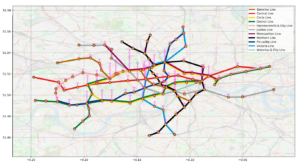 Graph 2: Betweenness centrality
ModelLing Commuter Population
Transportation modelling also allows us to represent net passenger flow, which can infer the resident population around each station. From observation results, the population mainly flows from a residential area to business districts during morning rush hour, and the stations with larger out-flow are located within the central commercial or financial squares, while residential areas show the greatest in-flow. So that we can estimate the resident population based on the morning net passenger flow.
Relying on the passenger flow and population density, it offers mathematical support for new-line planning and adjusting timetables for metro departure intervals.
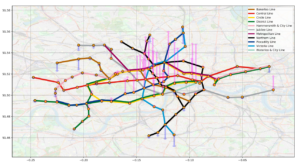
Graph 3: Net passenger out-flow (pink) and in-flow (blue) during the morning rush hour
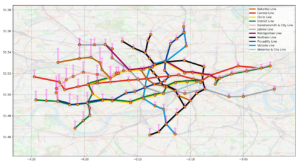
Graph 4: Population density implied by the graph model
Conclusion
Based on the results, it is possible to explore the underground’s design and management in a graph representation which offers an opportunity to improve the network and make better adjustments to resources.
References
Bruno, S. D., et al. Graph Theory for Metro Traffic Modelling. Department of Electrical and Electronic Engineering Imperial College London