It is well known that contagious diseases follow exponential growth. However, what if we can conclude a disease is contagious without looking back? In this blog, we try to explore how we can simplify this identification problem with a lot fewer data points using power law.
Introduction
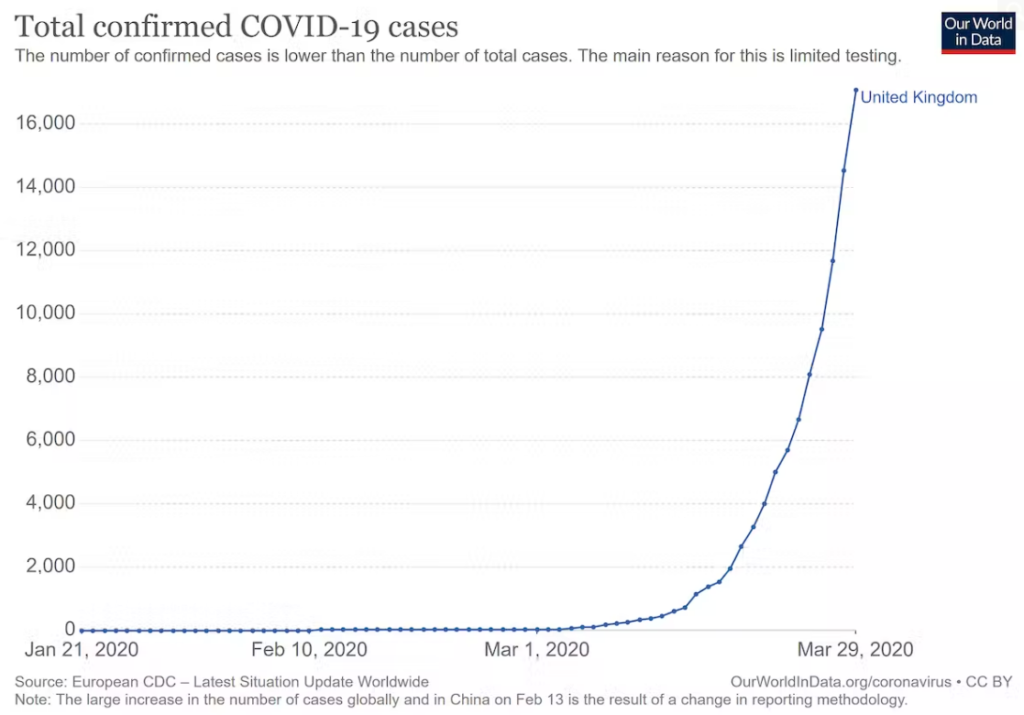
In this blog, we will use COVID-19 as an example, as it is the most accurate, recent, and large-scale disease outbreak. The data we will use will be exclusively for inside the United States. We will try to create a hypothetical power law model for COVID-19 for case numbers in each state of the USA, and see if the empirical data confirm our hypothesis.
Assuming you are already familiar with the basics of power law distribution, we will introduce one of the techniques to generate power law distribution. This technique introduced by Newman, allows us to generate power law distribution from a combination of exponential distributions:
Suppose some random variable y is exponentially distributed, i.e. p(y) is distributed exp(ay) with some constant a. Let x be another random variable that is exponentially related, not distributed, with y, i.e. x = exp(by) with some constant b.
Through the work of Newman, we can say that
p(x) = p(y)* (dy /dx) = (1/b) * x ^ (-1 + a/b)
Which is a power law distribution with alpha = 1 – a/b.
Analysis
We will try to mode
Suppose like any contagious disease, COVID-19 grows exponentially in the USA (at least in the start, without any measures taking place). Assume that the population of each state is infinite (o.w. we cannot guarantee exponential growth)
Let x be the number of cases in a US state:
x = exp(b * tx), b > 0 as per the assumption, tx = (t – t0) where t is the actual time and t0 is the time when the first case of COVID-19 appeared in the state.
Due to the USA being a crowded country, the time the first case appeared in different states should follow an exponential distribution. Intuitively, after the first case, in a closely connected country, other states should also start getting their first case. This could be a good research topic if we are trying to analyze the flight/train traffic of different states using graph theory, but let us keep things simple. We assume t0 is exponentially distributed and so will tx by the properties of exponential distribution:
p(tx) = exp(a * tx), a < 0 since as we progress in time, the likelihood of a state not having a case at later times is very low given the crowded, heavily linked transportation.
By our introduction, we have a power law distribution for x, the count of cases of an area in a crowded, heavily connected country. s.t. p(x) = (1/b) * x ^ (-1 + a/b) and alpha = 1 – a/b. Our xmin is 1 as cases are integers. (This is a special case where we do not need to do a compound distribution in-order to ignore the time t. To do that, see another example of time-related power law generation in Basu’s work where he coined the term Modified Lognormal Power Law Distribution. )
By intuition, the power law distribution we got should be extremely top-heavy where the majority of the cases lie in the tail of the distribution. In simple words, the majority of the cases are in the majority of states, which has a decent amount of cases. You should rarely see a state with a very low number of cases. By Newman’s work, is similar to the case where the wealth is distributed among the majority of the people instead of the people at the top. If this is true, the alpha should be < 2 for an extremely top-heavy distribution.
(The website of Physics of Risk is down. We will use an image from another article that articulates a similar fact. Note it uses a different technique than Physics of Risk)
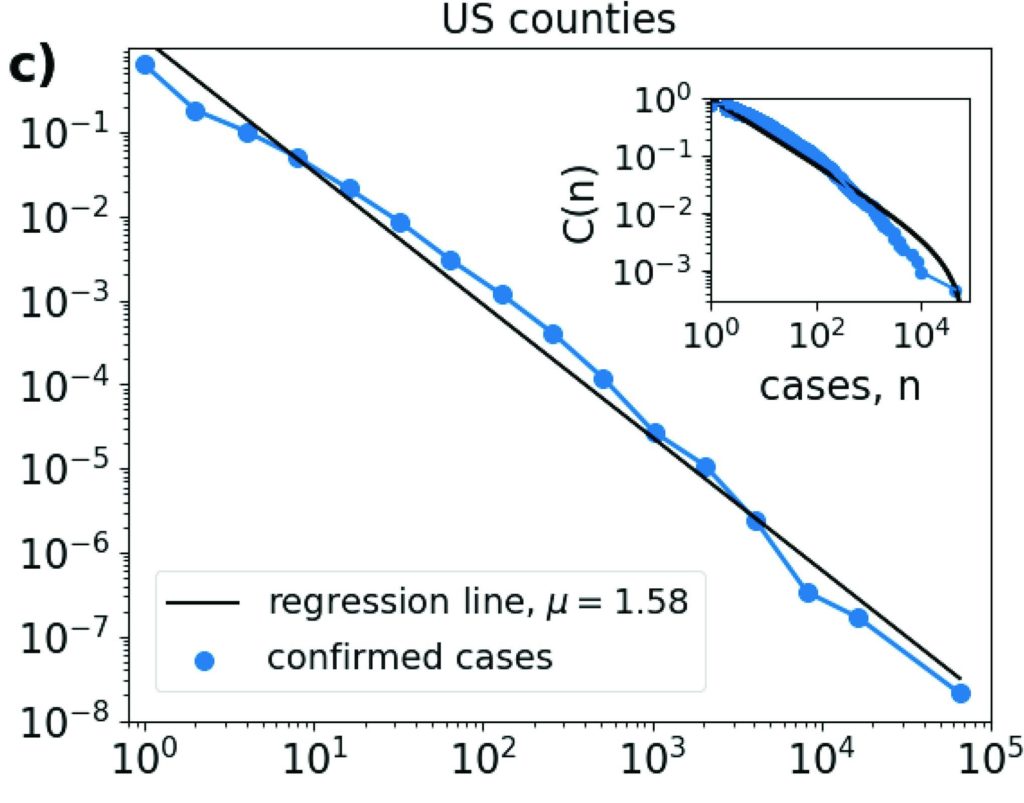
(Updated with Physics of Risk image)
To confirm our findings, we can see that the data from Physics of Risk where the cases of states in the USA are plotted shows clear power law behavior. On the log-log scale, it is a straight line, where the majority of the cases belong to states in the tail of the distribution. From the plot, we can also calculate that alpha is indeed < 2 as we hypothesized with our intuition.
Conclusion
In conclusion, we now see that a contagious disease should also display a power law behavior with a top-heavy distribution identifiable by alpha < 2. We now see that, if we face another disease, health organizations can use techniques such as KL divergence and Hypothesis testing to confirm the power law nature of a disease using steps in our analysis and announce its title as a contagious one. In the situations where growth data were missing or not able to be collected, we no longer need to worry as we have a new way to test the contagiousness of a disease using just the present data.
Sources
Physics of Risk. (n.d.). Covid-19 spatial growth. Physics of Risk. Retrieved November 3, 2022, from https://rf.mokslasplius.lt/covid-19-spatial-growth/
Basu, S., Gil, M., & Auddy, S. (2015). The MLP Distribution: A modified lognormal power-law model for the stellar initial mass function. Monthly Notices of the Royal Astronomical Society, 449(3), 2413–2420. https://doi.org/10.1093/mnras/stv445
Blasius, B. (2020, September). Power-law distribution in the number of confirmed COVID-19 cases. Chaos (Woodbury, N.Y.). Retrieved November 13, 2022, from https://www.ncbi.nlm.nih.gov/pmc/articles/PMC7519452/
Newman, M. E. J. (2005). Power laws, pareto distributions and Zipf’s law. Contemporary Physics, 46(5), 323–351. https://doi.org/10.1080/00107510500052444
One reply on “Show COVID-19 is a contagious disease with just one day’s data using Power Law”
Cool application in analyzing if the disease is contagious by using power law ! Thanks to your post, I believe that I have deeper understanding about power law.