Introduction
Critical Infrastructure (CI) are physical and organizational structures and facilities (i.e., building, roads, power supplies) needed for the operation of a society or enterprise and one’s failure can cause other cascading failures (IEEE, 2022). There have been many cases of critical infrastructure failure (i.e., Hurricane Sandy in 2012 causing enormous power utility damage leading to non-operation of major fuel pipelines, telecommunication infrastructure and water and sewage facilities) throughout history that have caused loss of life, harm to communities, negative economic impact, and psychological distress. Thus, it’s of great importance to identify infrastructures that are greatly interdependent to mitigate these potential risks. This can be done by using a similar algorithm to Google’s PageRank algorithm which helps place a criticality score (like a rank) on each infrastructure. This criticality score can then be used to predict the infrastructures that need the most protection from various catastrophes so that situations of escalating failures are limited.
Analysis
We first represent the infrastructures as a network/graph G = (A, E), where the nodes A represent infrastructures, edges E contain edges for two infrastructures, let’s say p and q ((p,q) in E) if p supplies a resource to q (q depends on p). Thus, if p fails, then q is also likely to fail. Then we identify three types of nodes:
- Vulnerable nodes – nodes which are likely to fail if any other node in the graph fails
- Important nodes – nodes whose failure causes many other important nodes to likely fail
- Critical nodes – nodes which are both vulnerable and important
To identify the vulnerable nodes, we run the PageRank algorithm on the original graph. Nodes with a high PageRank by definition, have many edges pointing towards them from nodes that have many edges pointing towards them and so forth. These nodes with high PageRank are the nodes we view as vulnerable nodes, since the more edges to a node, the more vulnerable it is because if nodes suppling to it fail, it is also likely to fail.
Similarly, to identify the important nodes, we run the PageRank algorithm on the reverse graph G’ (G with its edges reversed). Nodes with a high PageRank in reverse graph are nodes in G that point towards many nodes that point towards many nodes and so forth. These nodes with high PageRank in G’ are the nodes we view as important nodes, since they have many edges going out of them so the more important it is because if it fails, the nodes it points to are likely to fail as well.
For example, in the web graph where nodes are web pages and edges are hyperlinks, a web page “v” with a high PageRank in G would mean that if someone started on a random page, they are more likely to reach “v”. However, a web page “u” with a high PageRank in G’ would mean that clicking a random hyperlink in “u” would lead to seeing many different websites.
Now the critical nodes are nodes with a high criticality score which is just the average of the PageRank score for the node in G, and the PageRank score for the same node in G’.
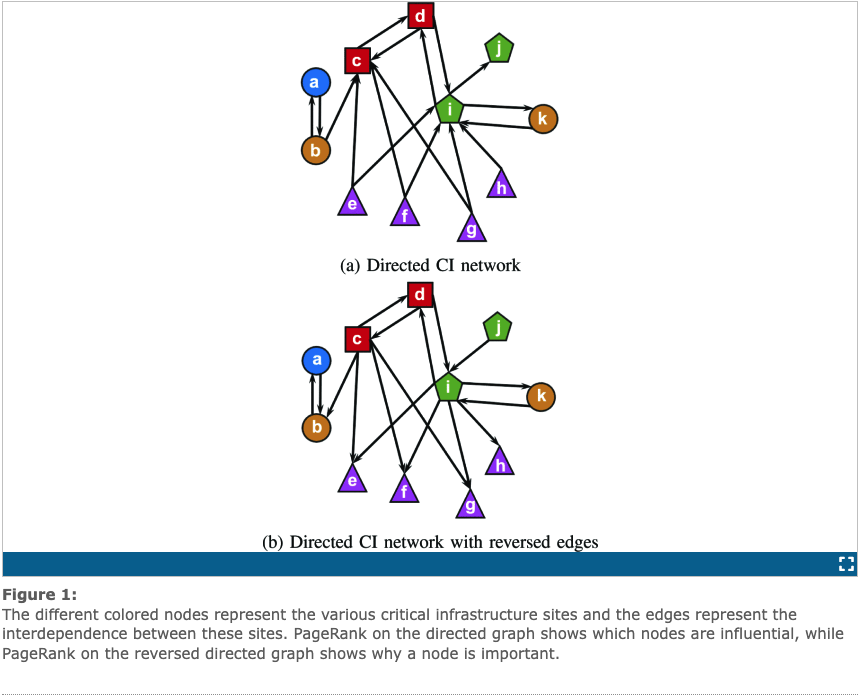
The above figure is an example of the graphs that would be computed to find the criticality scores for each infrastructure/node. Graph (a) shows d,c, and i as having high PageRanks meaning they are vulnerable whereas graph (b) shows b,a, and i as having high PageRanks meaning they are important.
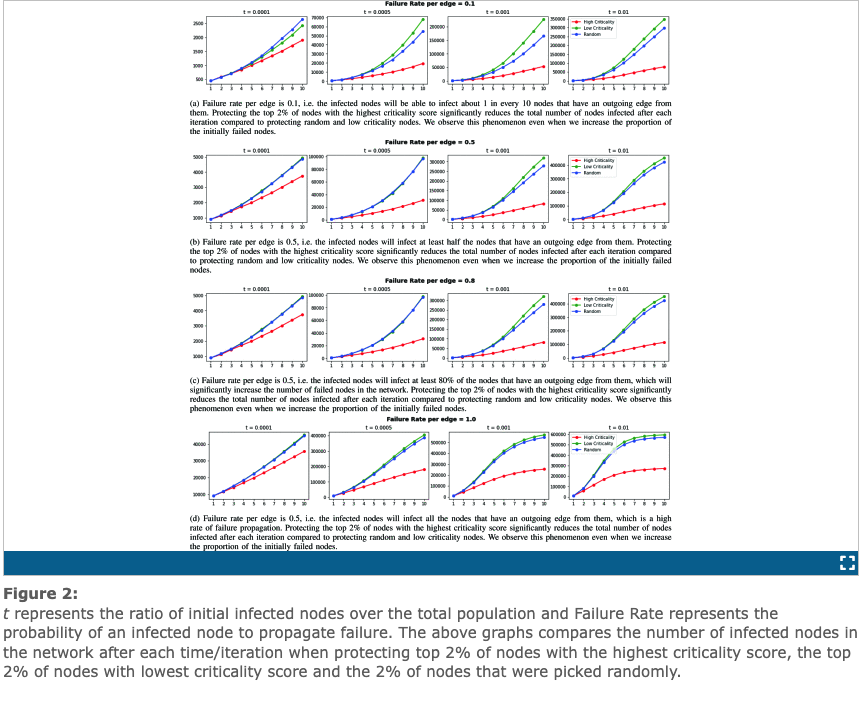
After applying the network science concept of PageRank to compute the criticality score for an infrastructure relationship graph, experiments on a real-world network were conducted where failure is induced in a small portion of nodes and then the propagation of this failure is observed under various conditions. These conditions include protecting the top 2% of highest criticality score nodes from failures, 2% of random nodes, and 2% of lower criticality scores nodes. Results showed a direct correlation between protecting nodes with highest criticality score and a networks resilience to infrastructure failure. That is protecting nodes with higher criticality score reduces cascading failures and number of nodes that are infected (reference figure below).
Conclusion
Thus, using network science, we can predict the infrastructures that have the greatest chances of impacting other infrastructures or being impacted themselves and those that overall cause most distress in an infrastructure network. Using this data, we can take appropriate steps to eliminate future failures that may occur by introducing various protection methods. For example, in the Hurricane Sandy in 2012 case above, if one is aware that major fuel pipelines have a high criticality score because of its reliance on power utilities, one can introduce protection measures like backup power to avoid the risk of having non-operating fuel pipelines. Ultimately, although the experiments conducted for this concept in network science doesn’t account for various factors like natural disasters or other unforeseen circumstances that may impact infrastructure failure propagation, it gives us a relative idea of the most critical infrastructures in the functioning of our society.
References
Identification of critical infrastructure via PageRank. IEEE Xplore. (n.d.). Retrieved November 16, 2022, from https://ieeexplore.ieee.org/abstract/document/9671620