In lecture 6 we learned about Power Laws and two characteristics of this type of distribution caught my attention. The first one is that Power-Laws can be found almost everywhere and the second is the rich get richer concept.
As a big tennis fan, I decided to check if both these concepts could be found in the men’s tennis world, specifically when analyzing the ATP Tournament winners. The idea is to determine whether the ATP Tournament Winners by ATP Ranking distribution could be an example of a power law by using the log-log and semi-log scaled graphs of the distribution and to understand whether the ATP tournament winners by ranking distribution fit into the rich get richer concept.
Tennis Background Knowledge
First, it is important to understand how the ATP Ranking system works and how each player’s ranking can impact their outcome in a tournament. The ATP ranking is formed by adding up the points gained in the 18 best results of professional tennis players in a particular year. In general, low-level tennis players play around 30 tournaments per season as they often lose in the first rounds of the tournaments, while high-level players play around 20 tournaments per year. In one year, there are four major tournaments called Grand Slams that give 2000 points to the winner, nine Master 1000 that as the name says, give 1000 points to the winner, thirteen ATP 500 tournaments and a good amount of low-tier tournaments that give 250 or less points to its winners.
Each tournament has a draw that defines the first-round matchup and potential posterior matchups for every player throughout the tournament. High-ranked players have the advantage of not being drawn with other high-ranked players until the latter stages of the tournament, which allows them to face more accessible rivals in the initial rounds.
Initial Analysis
My data source is a dataset by Jordan Goblet that includes every ATP match between 2000-2016, with the winner of every match, his ranking, the tournament being played and much more. For this analysis I decided to only use the data of winners of Grand Slam, Master 1000 and ATP 500 tournaments as in general, high ranked players don’t compete in low-tier tournaments like ATP 250.
Working with Excel, I grouped every ATP Ranking by the sum of titles any player with that ranking had won between 2000 and 2016 to get the distribution of ATP Titles by ATP Ranking.
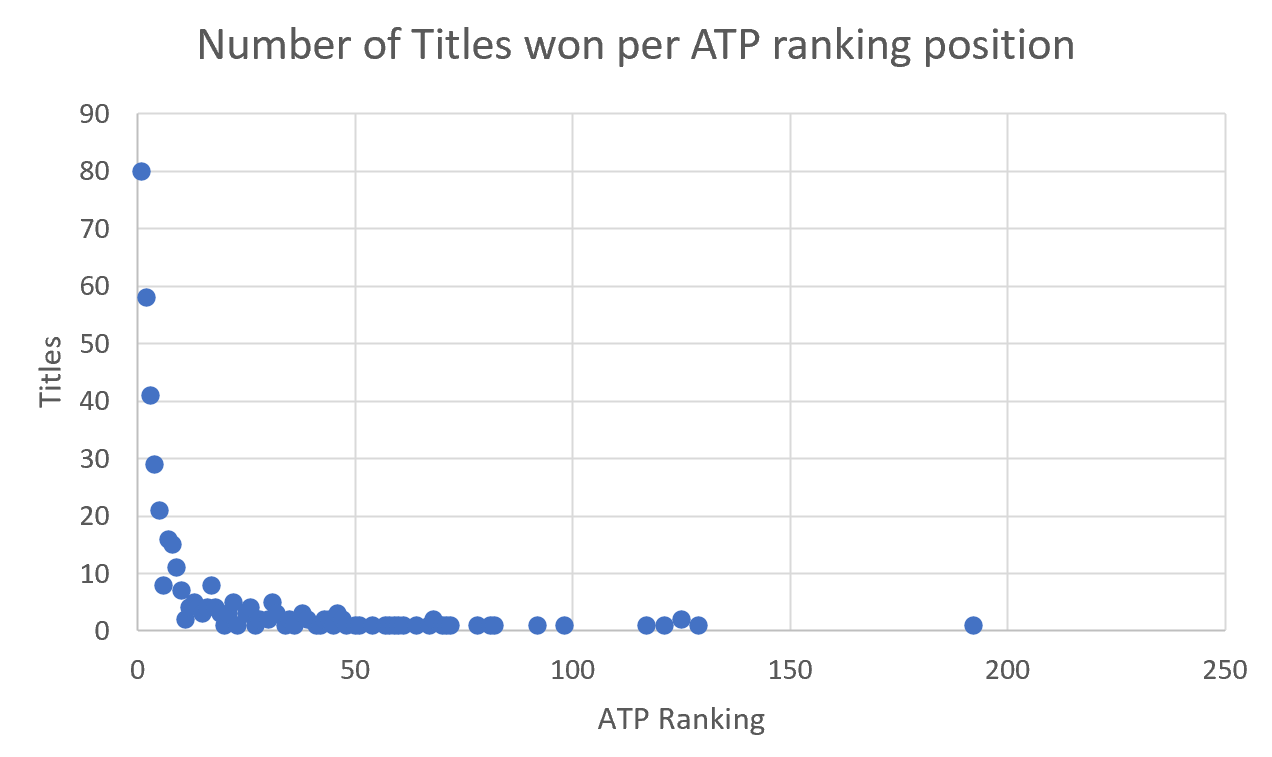
A few interesting facts arised from this action. For example, throughout the 16 year period, there was a winner from every rank between the 1st and 23th position in the ranking and the player with the lowest ranking to win a big ATP title was Florian Mayer who won the ATP 500 Halle Open in 2016, being the 192nd ranked player at that time. Here are the match highlights of that final, if you are interested in watching them.
Furthermore, I was able to find some characteristics of power laws in the data gathered. For instance, between 2000 and 2016, there were 401 ATP tournament winners of whom around 70% were ranked in a top-ten position. This result is consistent with the power law attribute that a small number of items are clustered at the top of a distribution. Another characteristic that arises, is that the distribution of ATP Titles might be heavy-tailed as the vast majority of titles were won by top-ten players whose rankings are far away from the mean which is approximately 45.
In this first approach, we can already notice the presence of the rich get richer concept as top-ten players won around 70% of the tournaments played. This can be explained by the way the ATP Tournaments draw works, where high-ranked players do not face other high-rank players till the latter stages of a tournament.
Further Analysis
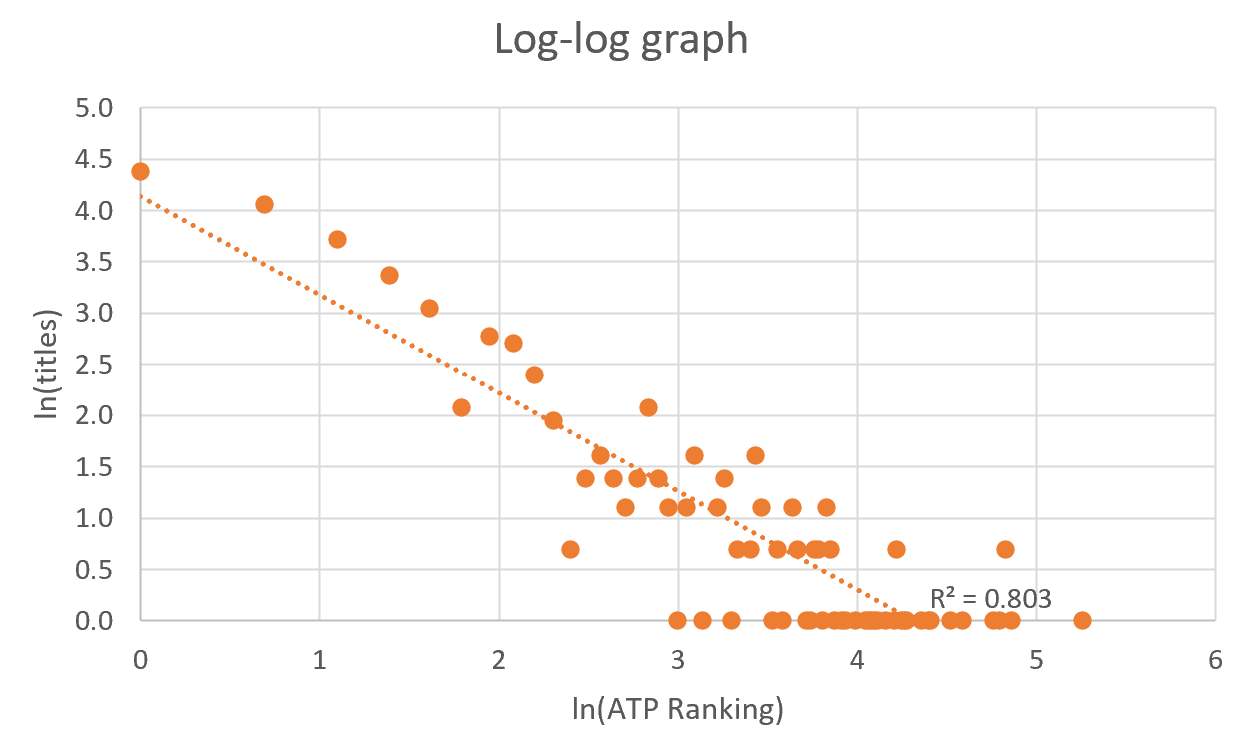
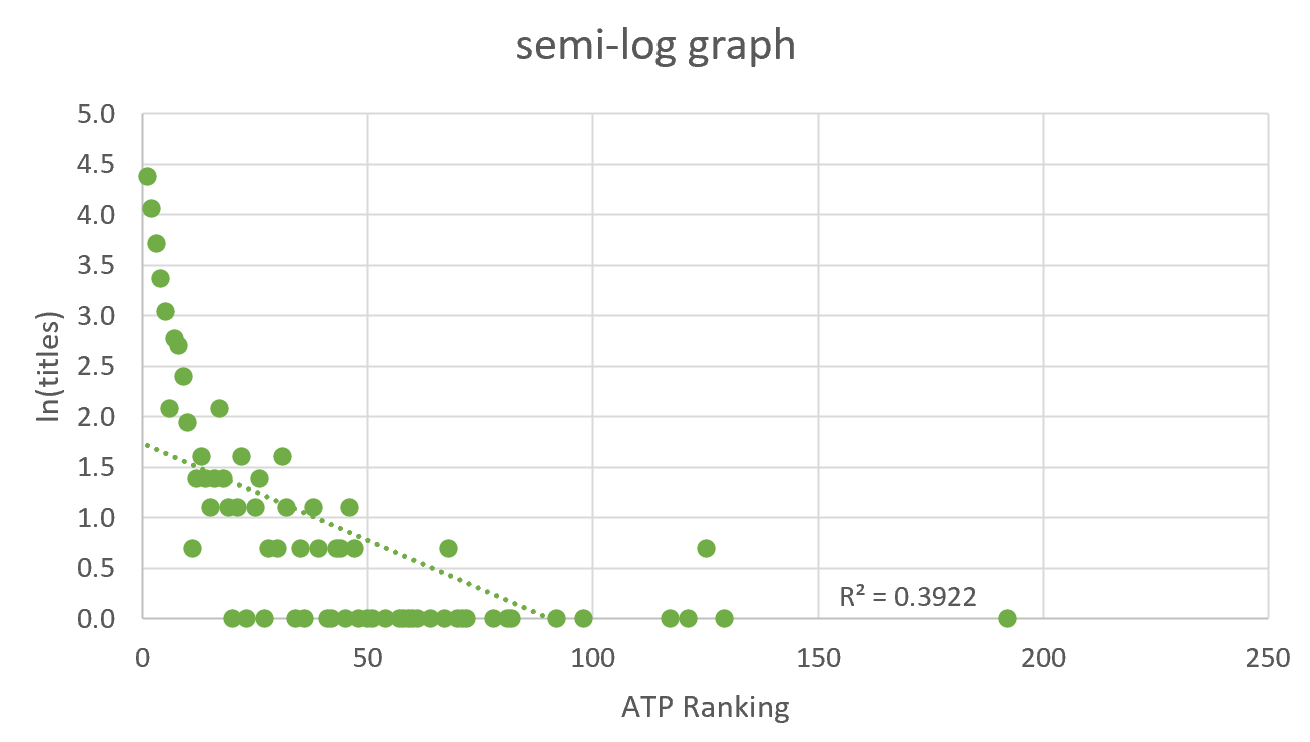
To finish my analysis, I plotted the data on a log-log scale and semi-log scale to determine whether the scattered data represented by a linear trendline was closer to being a power-law or an exponential distribution. I also calculated the R-squared of both representations. These are the graphs I got:
Conclusion
The results of the log-log scale graph show that a linear graph approximation of the tennis data has an R-squared of 0.803, while the results of the semi-log scale graph show that a linear graph approximation of the tennis data has an R-squared of 0.3922. In consequence, I can say that the log-log scale graph linear representation is better and so it is more probable that the ATP Titles by ATP Ranking has a power-law distribution rather than an exponential one.
So being more certain about the power-law distribution results and adding the power laws characteristics (heavy-tailed distribution and small number of items clustered at the top) that I found in the previous steps, I feel confident enough to say that the ATP Titles by ATP Ranking distribution could be another example of a power-law distribution in the real world and another example of the rich get richer phenomenon where high-ranked players are more likely to win more tournaments due to the way ATP Tournament draws work.