Introduction
Over the past couple of years, COVID-19 has rampaged its way through the world. In this blog post I wish to analyze COVID-19 as a contagion network, and use that to explain why its growth was linear in 2020.
Motivation
We discussed epidemics and contagion networks in class on week 11, and COVID-19 has been recently gaining traction again due to increased spread.
Analysis
A study by Thurner, Klimek, and Hanel assumes a critical number of social contacts d=7.2. This means that if one person meets more than 7.2 people per day (on average in a country) then traditional epidemiological dynamics occur, like SIR (susceptible, infectious, removed). If a person meets less than 7.2 people per day (again on average in a country) then more linear growth and lesser infection raters occur.
National non-pharmaceutical infection limiters (such as lockdowns) reduce the number of social contacts a person has per day. This number was found to be around 2.5 during a lockdown, and 5 during the pandemic (but no lockdown).
These numbers showcase the idea that under social conditioning (people being scared of COVID-19) the number of social contacts per day is below the critical number for a SARS infection, and, thus, can be modelled using a linear map. However, when social fears do not exist (around September 2020/2021, when people weren’t afraid of COVID-19 due to summer slowdowns) the number of social contacts people have increases and, therefore, COVID-19 follows a SIR model of epidemics again.
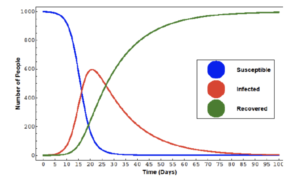
The below figure demonstrates a SIR model of epidemics. It is taken from lecture. The number of susceptible people shrinks as infection rates grow. This relation is also shown in COVID-19 charts only when social fears and lockdowns are not present.
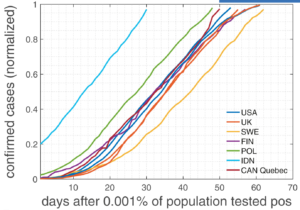
The below figure shows confirmed cases of COVID-19 days after 0.001% of the population tested positive. As you can see, growth is linear, demonstrating that lockdowns transformed the growth of COVID-19 from SIR modelled to linear. This relation exists in lockdowns and high social fear times.
Conclusion
In conclusion, it is easy to see that COVID-19 can be linearly mapped using non-traditional (SIR) methods considering social contact numbers and timeframes of lockdowns / social fears.
References
Thurner, S., Klimek, P., Hanel, R. (2020, August 24). A network-based explanation of why most covid-19 infection … – PNAS. A network-based explanation of why most COVID-19 infection curves are linear. Retrieved November 25, 2022, from https://www.pnas.org/doi/10.1073/pnas.2010398117