Introduction
Human displacement is the relocation of an individual usually driven by unwanted circumstances such as climate change, conflict, and human rights violations. Doing this is a deeply distressing task as they may be leaving friends, loved ones, and the comfort of familiarity involuntarily. In 2014, United Nation Refugee Agency showed that 59.5 million individuals were displaced so it is clear many are affected by this issue and need help in doing this process. When individuals are displaced they can often be missed by the proper response and support mechanisms that can help aid in their relocation. It was estimated in 2010, 52% of people displaced ended up moving to a location without access to formal humanitarian response or refugee camps. So with this knowledge, humanitarian aid agencies want to know the routes families take and where they relocate to so they can set up contact points. Also after migrating and arriving in safer areas, they would like to know who the best contacts are within a community so they can reach the most. I chose this topic because I was interested in how concepts learned in class (graph theory and social networks) can be used in real-world applications to benefit humanity and those in need.
Improving Outreach During Displacement Using Graph Theory
Aid agencies may have some opportunities to communicate with displaced people as they migrate but they don’t know where these people are likely to be at any given time. However, with graph theory, we can figure this out.
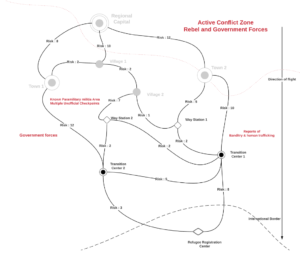
Here the graph has nodes as locations and edges as the cost of traveling to that path (weight given by how much risk it is to take that path) Knowing the logical routes that people are likely going to take is useful as it can tell aid agencies how to shift their resources to the appropriate places. This can be done using Dijkstra Shortest Path Algorithm or Floyd-Warshall Shortest Path Algorithm. Although in class we mostly deal with unweighted graphs, you could choose to remove weights and use Girvan-Newman Algorithm to analyze the flow and see how many shortest path travel through an edge. This can be useful in seeing which locations are crucial in between start and end destinations where you can then set up checkpoints or provide military support to make sure those areas are safe to use. You can see the same graph can be looked at in many different ways and these alternative methods can each help build a better plan to provide aid.
Improving Aid Through Analysis of Social networks
After the migration phase, we can improve humanitarian aid after they have settled. Not everyone is registered officially with humanitarian aid institutions so a large population will need to rely on help from friends or family. Since humanitarian aid has limited resources in time and money, they want to have an optimal way of identifying which people in communities have the best outreach to displaced individuals. This is so they can efficiently provide support to those missed and also have the best outreach to communities in general.
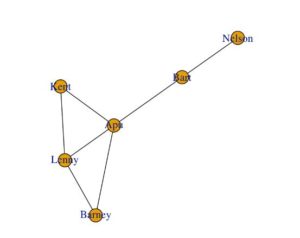
Here is a simple example of how they chose the best candidates. Here the nodes are people in a community and the edges are if they know each other.
Here is a table with each person’s degree, normalized centrality, betweenness centrality, and eigenvector centrality. Here they analyzed degree and normalized centrality but these aren’t enough to extract useful information on who’s best to choose and in some cases as you’ll see later on, miss important people like Bart. (Bart, Barney, and Kent have the same normal centrality but Bart is a better choice) Closeness Centrality is better but still not ideal as using between centrality and eigenvector centrality.
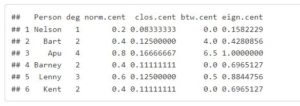
The betweenness centrality measure uses the count of the number of shortest paths in a network that goes through a specific node. The nodes that are key in relaying information in a network are those with high betweenness.
Also, you can use Eigenvector Centrality which is the gauge of influence a node’s connection in the network is to other “popular’ nodes. The more a node is connected to high-scoring nodes, the higher the eigenvector centrality score. Using betweenness centrality and eigenvector centrality uses these values to choose who is the best to reach out to as.
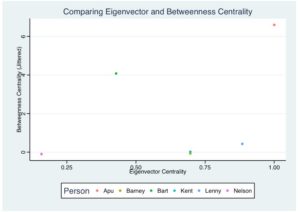
Here you see obviously that Apu is a great choice to contact since he is the best connected to the most popular people (highest eigenvector centrality) and best to pass down information to others. (highest betweenness). Another great choice would be Bart as he is a “critical gatekeeper” since he has a large betweenness but a relatively small eigenvector. He would be essential in reaching those less popular outliers like Nelson who are likely to be missed from Humanitarian aid. It is quite obvious with a simple example who to choose but since millions of people have been displaced and they themselves are connected with millions of others, being able to choose without analyzing the social networks is much more difficult. This is why analyzing the social network is a great tool for humanitarian staff as you can see much easier who are the best candidates to contact.
References
Using graph theory and social networks we can try to maximize help provided to those displaced by helping improve outreach to those migrating or having settled after displacement. Although I used human displacement as the direct problem we can help solve, I hope you can see the problem of optimizing outreach is present in many different topics.
Thanks for reading!
Sources
https://rstudio-pubs-static.s3.amazonaws.com/134551_75530f2689aa4103879d969aee6e7fba.html
https://www.unhcr.org/556725e69.html#_ga=1.74777362.1880093282.1447460740