Introduction
The power law is a phenomenon that appears in surprisingly many different contexts: from usage of unique words in a novel, and the amount of air traffic in different airports, to the number of times research projects are cited. In 2018, Deferico Etro and Elena Stepanova from Ca’ Foscari University of Venice have found that this phenomenon also appears with the relative significance of artists throughout history.
Assumptions and Data Acquisition
As a way to measure an artist’s significance, the average price of a given artist’s artworks is assumed to be indicative of this: the higher the prices of artworks of a given artist, the more significant they are. Two different types of prices are sought: those from the primary market (where an artwork is sold for the first time) and those from the secondary market (where an artwork is sold in all subsequent times). Another way an artist’s significance can be approximated is by the number of students they had: the more significant an artist is, the more students they attract and, therefore, teach.
Sets of prices have been retrieved from historical economic sources as well as from data on auction sales from the relative recent past, and they are categorized by different eras and locations. Taken into consideration are 56 Italian artists from 1285 – 1550, 277 Dutch and Flemish artists from 1597 – 1700, 494 French artists from 1745 – 1820, 556 British artists from 1780 – 1840, and works by 575 artists of any location and time period sold in auctions from 1985 – 2016. In addition, a network of 1906 Dutch and Flemish masters and apprentices from 1500 – 1700 has been reconstructed.
Data and Analysis
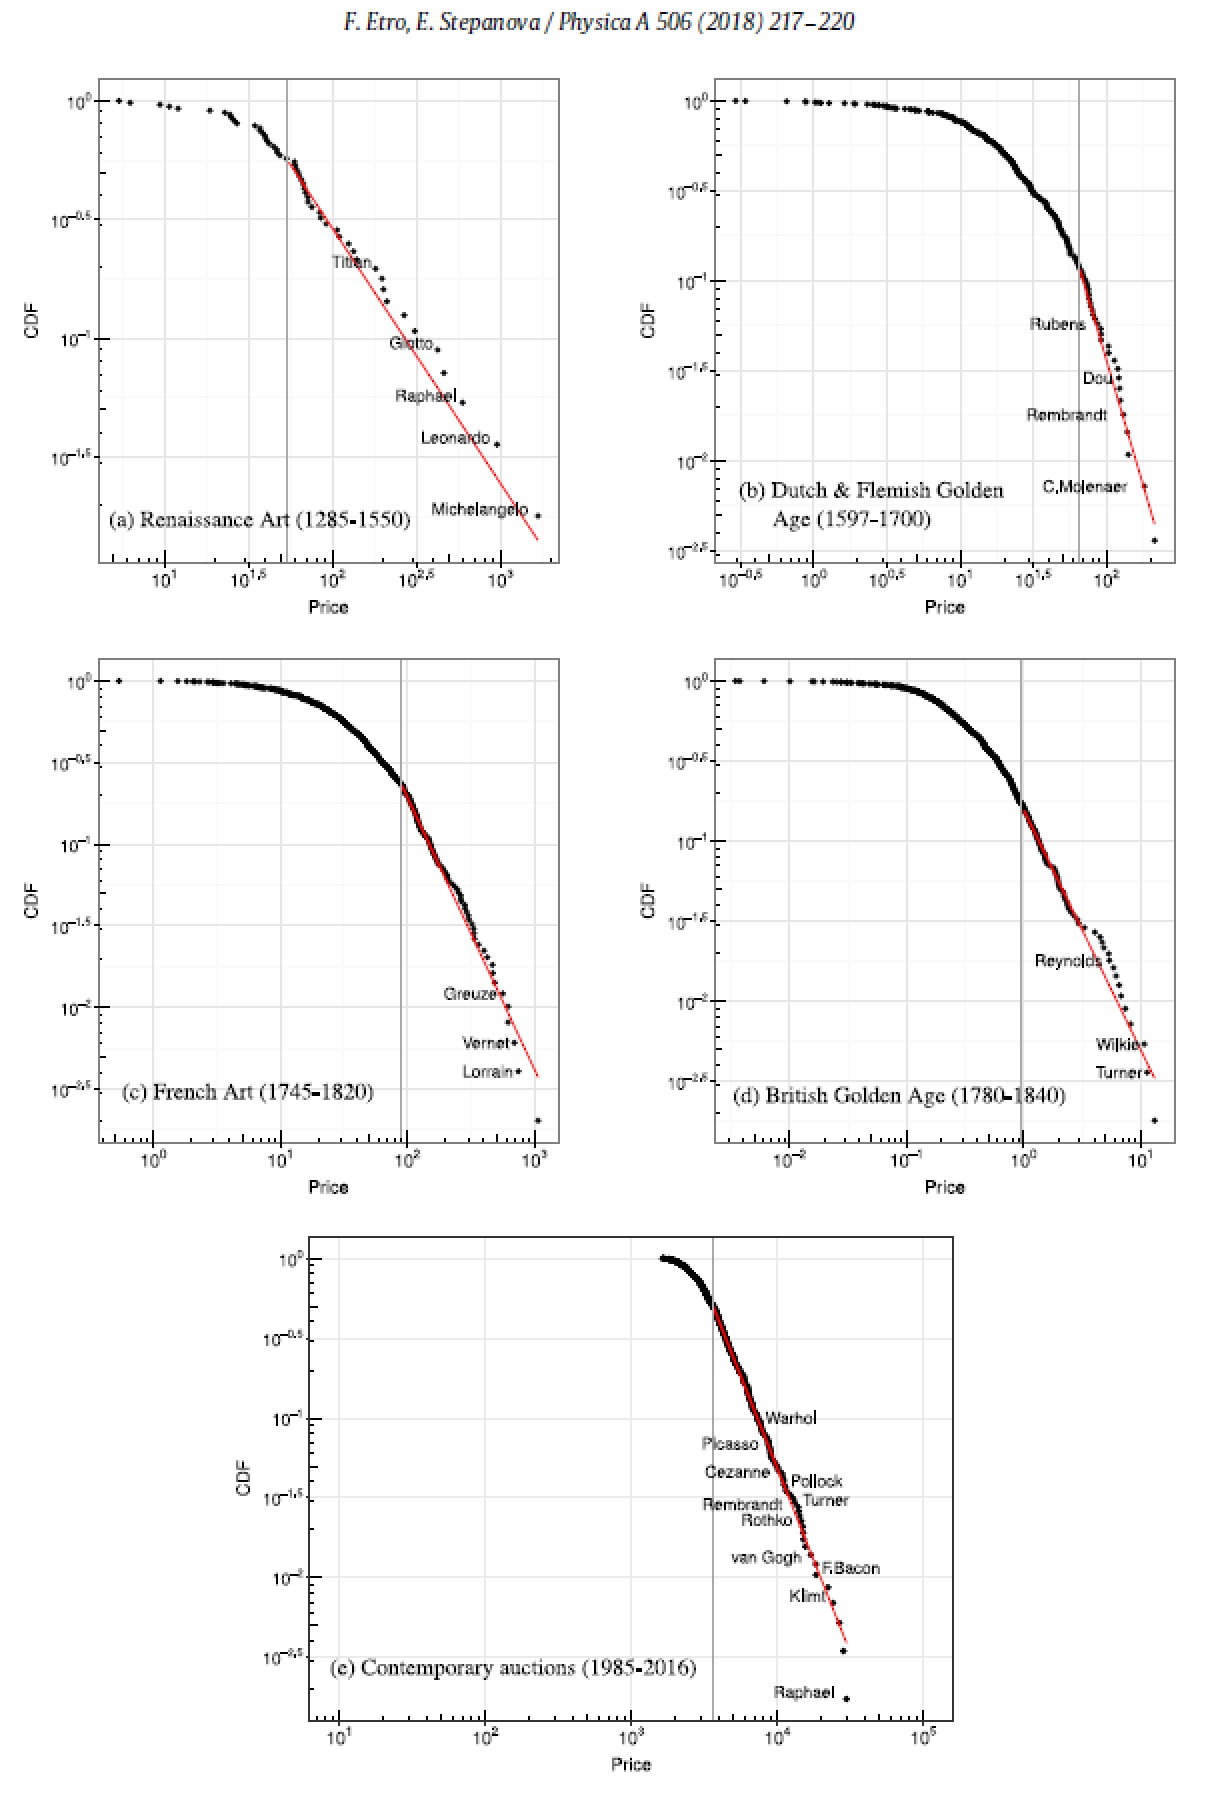
Figure 1: the power law distribution of artists by region and time period by the average price of their artworks.
From the data gathered, five graphs have been created showing the distribution of average prices of the artists’ artworks, categorized by the aforementioned regions and time periods (figure 1). All of them show a power law distribution as they follows p(x) ∝ x-α with different values for α: α ≈ 2.1 for the Italian artists, α ≈ 3.8 for the Dutch and Flemish artists, α ≈ 2.7 for French artists, α ≈ 2.5 for British artists, and α ≈ 3.3 for the sales of artists’ artworks in contemporary auctions.
While it may not be obvious as to what specific factors were involved in making artists’ relative significance follow the power law, it makes intuitive sense that it does simply from the fact that there have been many artists throughout history but we only know a relatively small number of them. But a greater understanding of historical context may provide explanation. For instance, in the Italian case, that the three right-most artists on the graph – Michelangelo, Leonardo and Raphael – were all born within a short time span of 30 years is not necessarily surprising with the insight of power laws in mind: a disproportionate number of significant artists may emerge due to numerous different factors aligning in a specific way. The three aforementioned artists were living well within the Renaissance era which was a time of prosperity and innovation in Italy; the environment in which there was high demand for art and artistic innovations allowed them to thrive as artists. And in the Dutch and Flemish case, the higher α value indicates the greater relative prevalence of less significant artists, as well as being expected for the first artistic mass market. The lower α values associated with the later French, British and contemporary art markets may be indicative of its development with the emergence of networks for art dealers, and the use of artwork as investments: such developments may have made it possible for a greater proportion of highly significant artists to be found.
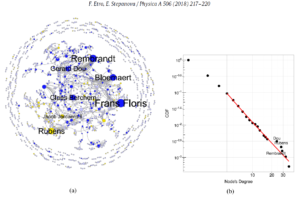 Figure 2: Dutch and Flemish masters by their students depicted in a network (figure 2a) and in a power law distribution (figure 2b).
Reconstructing this network of 1906 Dutch or Flemish masters and apprentices, there is a giant SCC that contains 60% of the links (figure 2a). Plotting this data on a graph (figure 2b), we find that the distribution of students to masters also adheres to power laws where α ≈ 3. The artists Dou, Rubens and Rembrandt are among the most significant by the average value of their artworks, and from the fact that they are among the artists that have mentored the highest number of students within the time period and location considered as is illustrated by their right-ward position in the power law distribution (figure 2b), and their prominent position in the SCC (figure 2a).
Conclusion
As we have seen, even the seemingly non-statistical world of art is not exempt from universality of the power law. Though there may not be perfect ways to measure something as subjective as the significance of a given artists, the assumptions and method chosen by Etro and Stepanova nevertheless offer us a way to approximate this seemingly intangible quality from the perspective of graph theory.
Source
Etro, Federico, and Stepanova, Elena. “Power-laws in art.” Physica A: Statistical Mechanics and its Applications, vol. 506, September 2018, pp. 217-220. https://doi.org/10.1016/j.physa.2018.04.057