Introductions:
It’s quite rare to be able to see the growth of new platforms on the internet, as they usually only reach the public eye once they have become incompressible big. a rare instance of this for me is Twitch.tv, a streaming platform that’s primarily aimed towards gamers. Since its creation in 2011 it has primarily stayed as fairly niche gaming community, only somewhat recently gaining mass attention thanks to covid. Twitch, has developed an extremely rich culture and history thanks to the interesting dynamic between viewer and streamer. a streamer is a user who broadcasts a live show that viewers can interact. As most data is publicly available, it’s possible to watch the platform and its communities grow in real time. Watching the growth of Twitch’s communities is fascinating as it somewhat simulates the internet in a small manageable subset. through twitch we may be able to understand how people in a community connect with each other as a community grows.
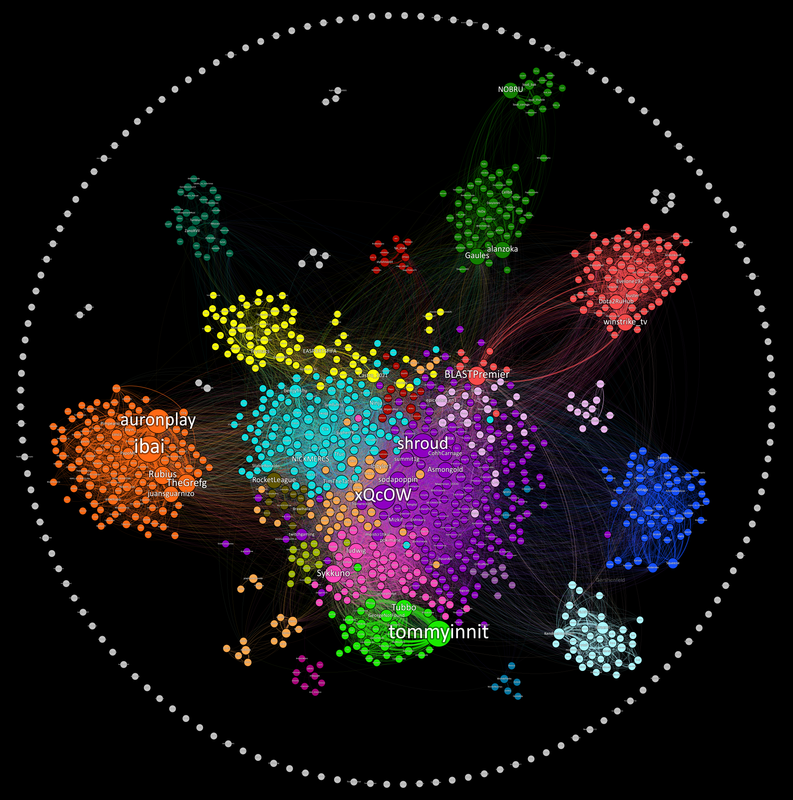
Twitch map December 2020
Research:
In 2020 Kiran Gershenfeld, began a project to track Twitch.tv communities over a few months. He scrapped Twitch’s Top 100 streamers each day over 5 days to develop a screenshot of twitch’s communities for that month. each node represents a streamer, where the size is dependent on the number of unique viewers watching. there is an edge connected two nodes if there is a viewer that watches both streams, where the edge’s thickness is proportional to the number of shared viewers. For example “Tommyinnit” has a very thick edge connected “Tubbo” as they share lots of viewers. lastly Gershenfeld colored the nodes based on shared viewers. 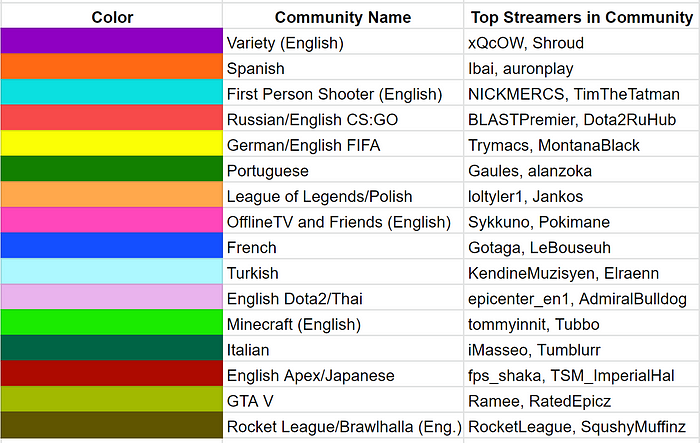
Twitch Legend, December 2020
the most interesting thing to note about the twitch graph was its scary accuracy at establishing real connections between streams through only their viewers. This is a scary example of strong triadic closure (STC). a viewers who watches both “TommyInit” and “Tubbo” are extremely likely to also watch “GeorgeNotFound”. These three being an a Minecraft trio and friends who commonly play together. taking this a step further we get the communities established through strong (lots of shared viewers) and weak ties. Interestingly enough, the groups followed a very simple pattern. Either being language groups (Italians, French, Turkish), games (Minecraft, GTA) or real twitch organizations (OfflineTV, OTK). This graph could just have easily have been a strong and weak tie graph representing if streamers were friends versus associates and it would almost match up completely.
Progession:
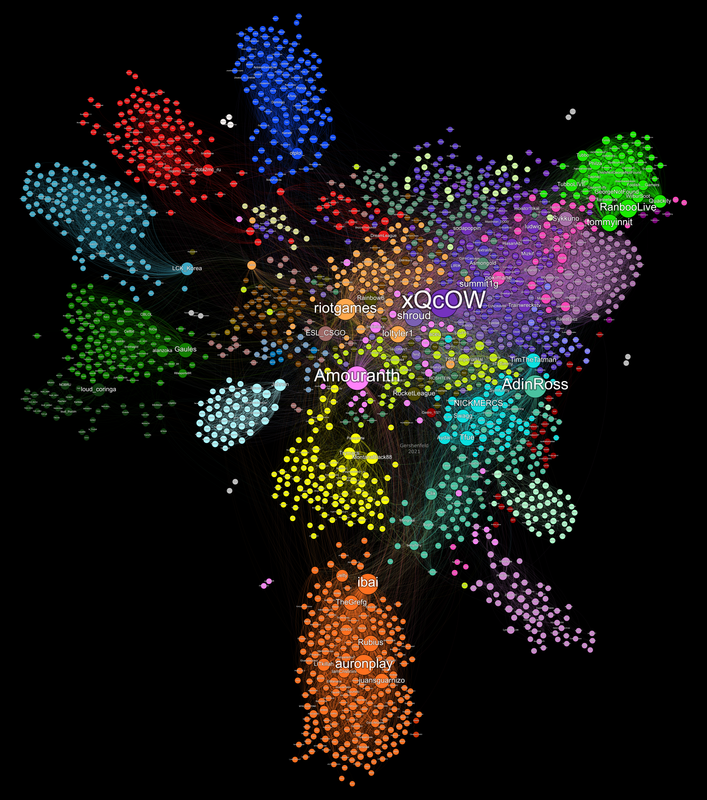
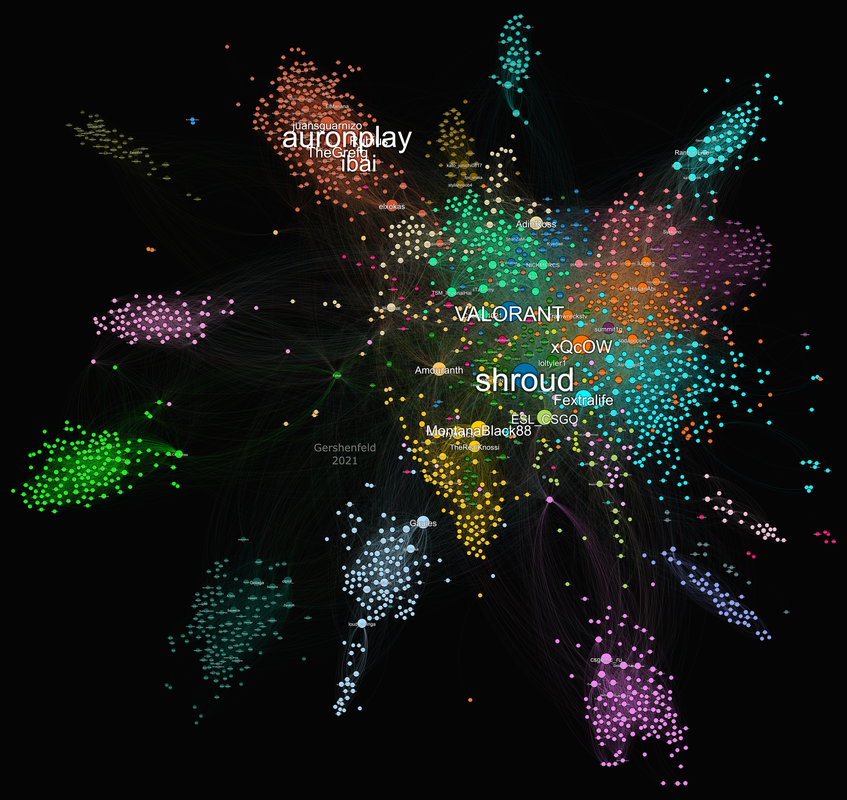
Gershenfeld released a version of the Twitch community map once a month for a few months. With that we were able to see a few patterns with how communities form. below are three months (December, May and September). While some communities grew and shrank it’s very clear that as time went on twitch became a more diverse platform. the top 100 while still very English community dominated, is slowly starting to lose out to other regions. This could explain what happens when a platform becomes more internationally accepted outside it’s country of origin. Another interesting development are psundo tendrils. While this graph is undirected, it’s clear that some streamers act bridges to SCC of the English community. an example of this is “Faker” for the light green community of koreans in September’s graph. While the koreans are connected to “Faker”, only faker seems to be strongly connected the SCC. Faker being the most famous league of legend player, acts as a gateway for english viewers to watch korean streams. or in other words Faker as further node from the English community, provides more information to his socially embedded group of Korean streamer.
Twitch map May 2021
 Twitch map September 2021
Conclusion:
the small snapshot of Twitch’s growing communities is an interesting case study into how communities grow on the internet. an area of focus is the relationship between viewers and streamers (by extension any online creator). We are able to predict fairly accurate relationship through viewing habits of viewers. Were able to see how real world events shape the platform and the rise and fall of communities. But how many of those real world relations are predicted by twitch or created because of it?