Introduction
“Medicine, law, business, engineering, these are noble pursuits and necessary to sustain life. But poetry, beauty, romance, love, these are what we stay alive for”. These words uttered by Robin Williams in 1989’s Dead Poets Society are remembered by many as one of his greatest quotes. It is the message carried by his words that we embody as we pursue stories, be it through literature, theatre, film, comics, etc. Such stories become sufficiently significant in our, the consumers’, minds to push us to create fanfics, discuss theories, generate memes, and more. In doing so, these stories accrue importance and warrant deeper analysis. Academics, consumers, and authors have conducted many forms of analyses on the stories of their interests, and a subset of those methods stem from modelling character relations using graph theory.
Modelling Character Relations as Graphs
Before any analysis can be done, it is important to understand how to appropriately model characters and character relations. Many authors and scientists use individual characters as nodes, however, it is important to note that parties, provided sufficient homogeneity, can be collapsed into one node as well. There are also different approaches to identifying character relations:
- Co-occurrence of characters
- Direct verbal interactions between characters
- Explicit mentioning between characters
- Non-verbal interactions
- Character affiliations
Most use some combination of the above to model character relations. For the purposes of our study, characters are viewed as nodes and the terms are used interchangeably. Edges between nodes are viewed as some connection of the aforementioned types, and are more specifically defined when needed.
On the Individual Scale: How Characters Influence the Story
Many statistics can be gathered to understand how a particular node fits into the graph. However, the most interesting and influential metrics tend to be centrality measures that shed light on how characters impact the narrative, especially with respect to the rest of the cast.
Degree and strength
One may assume characters with higher degrees are more central to the plot and thus important. This is true in many cases, but lead to inaccurate results when measuring stories with “messenger” characters that interact with others. Thus, the strength of a node must also be accounted for. The strength of a node is calculated by aggregating the absolute value of the weight of its connections, which gives a more accurate measurement of the impact of the character.
Betweenness
This measures how much characters act as narrative bridges. If a character’s relation has high betweenness, characters tend to rely on said character to interact with others. In doing so, it accurately measures which characters act as messengers relaying information (when measuring verbal communication) or catalysts triggering action (when measuring non-verbal communication). Moreover, the between-centrality measures how significant a character is to a plot, and often singles out one character in a story revolving around one hero’s journey or multiple protagonists in a poly-focalized story. A centrality measurement based on betweenness can be calculated by averaging the betweenness of a character’s relations.
Closeness
Closeness is determined by the reciprocal of a node’s total (or average) distance (in terms of shortest paths) to all other nodes in the graph. However, this heuristic often has little variance when studying tight stories and breaks down when studying disconnected graphs (stories composed of multiple subplots such as Moonlight or Beowulf). Thus, many often use harmonic centrality instead, where one sums the reciprocals of the distances. Ultimately, the heuristic measures how relevant characters are to central plots. Stories following a small party of protagonists tend to have lower closeness as the drama leverages interplay between various parties in the story, leading to greater chains of character relations. Stories featuring a singular protagonist on a hero’s journey-like adventure feature greater closeness as most other characters will only directly interact with the hero, making him a bridge to most shortest paths.
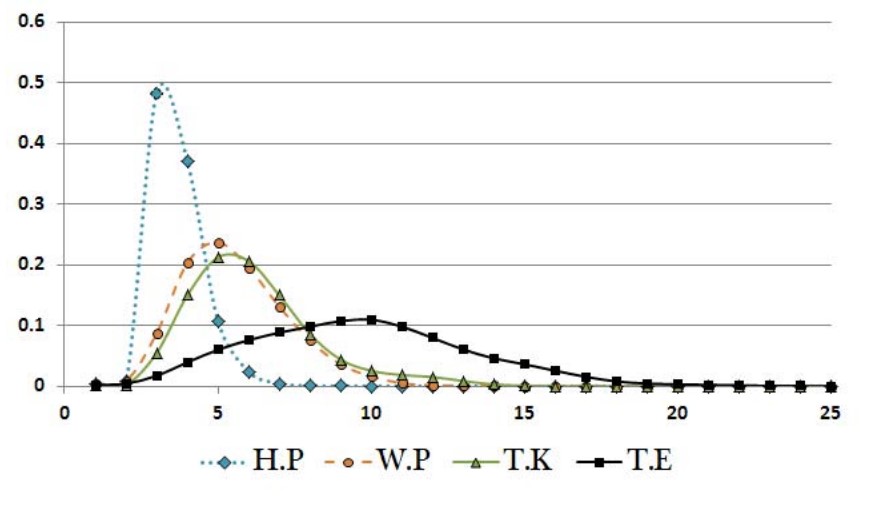
Fig. 1: Normalized character to character distance distribution across Harry Potter and the Philosopher’s Stone, War and Peace, The Three Kingdoms, and The Earth.
On a Global Scale: What the Graph Tells About the Story
Investigating individual nodes illuminates the details of each character, but does little to shed light on how the story works on a more general scale. To understand such factors, a more global study of the graph is needed. Two key features that tend to be informative are the communities (clusters) found in the graph, and the triads (and their structure) that can be found.
Communities
Many stories have characters fall into certain cliques (protagonists, antagonists, supports, families, etc.). Grouping the nodes into communities clearly identifies the cliques present, and allows for further study on their relations by forming a metagraph. For example, Shakespeare’s plays often featured strongly structured and easily identifiable communities with very high correlation, as they often shared scenes together to maintain transparency and invoke drama. Such communities also develop narrative expectations within the consumer. As such, authors often make their communities distinct and members are often easily distinguishable when sharing scenes. On the other hand, the expectation is exploited by authors who leverage it to build treacherous characters or plot twists.
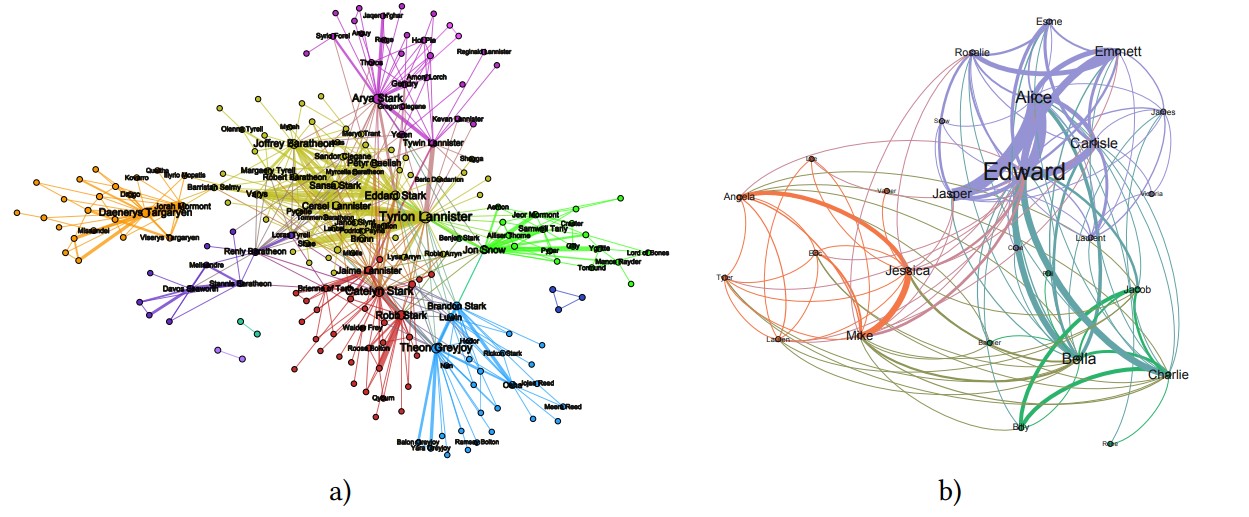
Fig. 2: Communities in seasons 1 & 2 of the TV series Game of Thrones (a) and the three novels of Twilight (b).
Triads
Relations between 3 connected characters can form a triad. It is important to note that the structural balance of triads have great implications on their impact on the story. Triads that remain balanced are often of little prevalence to the story, as they do not provide internal conflict or drama, though they can have significant impact based on external conflict (e.g. 3 witches in Hamlet). Unbalanced triads are often more central to the plot as they feature a conflict, and usually become balanced by the end of the story. This is most prevalent in love triangles, where the original conflict manifests an unbalanced triangle (one negative and two positive edges), and its resolution produces a balanced one (three positive edges in polyamorous stories or solutions where the “third wheel” dies or becomes inaccessible, and one positive edge and two negatives when the “third wheel” proves themselves to be antagonistic).
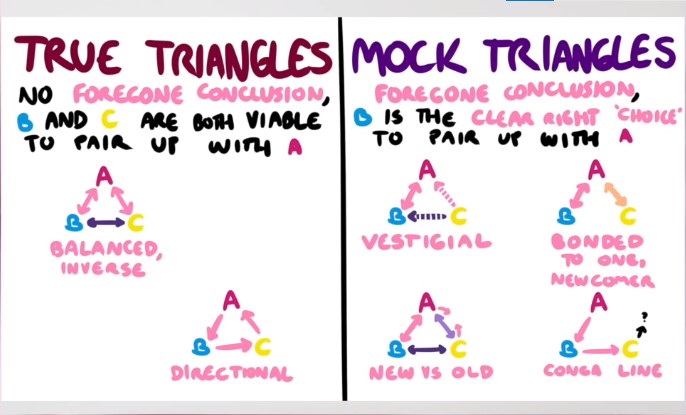
Fig. 3: Unofficial classification of love triangles found in stories by Overly Sarcastic Productions (positive relationships in pink, negative in purple).
Applications
Such analyses can reveal interesting findings about how stories are composed and consumed.
They can shed light onto the structure of a story. This can be used to identify key features of how stories are created. For example, Stiller et al studied 10 Shakespeare plays to see if the societies in his stories mimicked that of the author’s to understand if historic accuracy is significant in successful plays.
Narrative structure can also be used to classify stories and draw relations to other stories of similar form. Consumers often do this subconsciously in order to form extrapolations, make sense of the story world, and relate it to other stories they consumed. Thus, it is important to understand this feature to capture how the story will be perceived by its audience.
Authors also use such studies to conduct role detection to see how broad or personalized a character is. Broad characters fall into general archetypes and are easily remembered but not particularly interesting. Thus, such characters are often support to the central plot points. On the contrary, personalized characters are well developed and interesting and are more often central to the story. If authors break these “rules”, the story is liable to confusion and poor reception, and so such a study can be used as a tool to maintain proper narrative form.
Ultimately, thorough analyses into stories through modeling character relations through graph theory can be used by academics to better understand literary theory and what makes good stories, authors to understand how their audiences may receive a story and compose good ones, and consumers to understand the media they consume for a more enriching experience.
References
- P., V. (2022, January 6). Mining & Modelling character networks - part I. Medium. Retrieved October 7, 2022, from https://towardsdatascience.com/mining-modelling-character-networks-part-i-e37e4878c467
- Vincent Labatut and Xavier Bost. 2019. “Extraction and Analysis of Fictional Character Networks: A Survey” . ACM Computing Surveys 52(5):89. https://doi.org/10.1145/3344548