Introduction and Motivation
Online learning is still very prevalent in today’s world even after the pandemic has subsided. Lots of courses are still being delivered online, and even courses requiring you to attend in person will have some sort of online presence, including forums such as Quercus, Piazza, and Discord, for students to ask questions and have discussions. However, how do we measure the participation and interaction between students in these online environments? Currently, there are built-in tools within these applications that provide basic information such as post frequency, but they ignore information regarding how students interact with one another in terms of relevancy and their influences to the discussion, as well as the relationship between topics and key terms that are being discussed.
This article elaborates on gathering various types of data necessary to analyze the participation between students in an online environment in addition to social network techniques such as closeness, centrality, and betweenness, etc… to evaluate the interactions between students.
Analysis
Extraction of Social Network
To begin performing social network analysis, the article begins by explaining different techniques to extract the data. Initially, many different types of methods were proposed to evaluate the interaction between students. However, all of these methods analyzed information strictly based on student posts. This, in turn, did not provide much detailed information regarding the participation between students because there are many other factors that should be considered in addition to only evaluating student posts. As quoted on the article, “Hrastinski 2008 suggested that apart from writing, there are other indicators of participation like accessing the e-learning environment, reading posts or the quantity and quality of the writing.” (Mansoureh et al., 2011, as cited in Hrastinski 2008).
Nine Indicators for Measuring Effectiveness of Participation
As a result, there are much more indicators that need to be evaluated in addition to only looking at student posts. Below is an image of Figure 1 along with a quote from the article that describes nine different ways the effectiveness of participation can be measured.
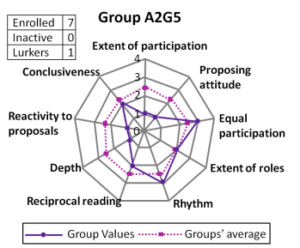
“In the education context, Calvani et al. 2009 defined 9 indicators for measuring the effectiveness of participation to compare different groups within a class; extent of participation (number of messages), proposing attitude (number of messages with proposal label), equal participation (variance of messages for users), extent of role (portion of roles used), rhythm (variance of daily messages per day), reciprocal reading (portion of messages that have been read), depth (average response depth), reactivity to proposal (number of direct answers to messages with proposal label) and conclusiveness (number of messages with conclusion label); all summarized in a nonagon graph which shows the group interactions relatively to the mean behavior of all groups (Figure 1).” (Mansoureh et al. 2011, as cited in Calvani et al. 2009).
Social Network Analysis for Education: Meerkat-Ed
The article then describes a toolbox that the authors have created to perform the social network analysis that incorporates more than just the built-in statistics tools that the online platforms provide. “Meerkat-ED builds and analyzes two kinds of networks out of the discussion forums: social network of the students where links represent correspondence, and network of the phrases used in the discussions where links represent co-occurrence of phrases in the same sentence.” (Mansoureh et al., 2011).
This allows professors to easily view the relationship between interactions of students and identify ones that have bigger influences in discussions relative to others. It can also help to identify students that are lurking within the class as opposed to those that were actively working and contributing. Not only that, but it even allows them to identify the usage of specific terms within discussions.
Social Network Graph Results
Below are examples of two figures that illustrate the social network graphs that can be produced from the toolbox that the authors have created. There are many other social networks that can be generated by this toolbox which dives deeper into the relationship between student interactions and term communities which can be found in the article.
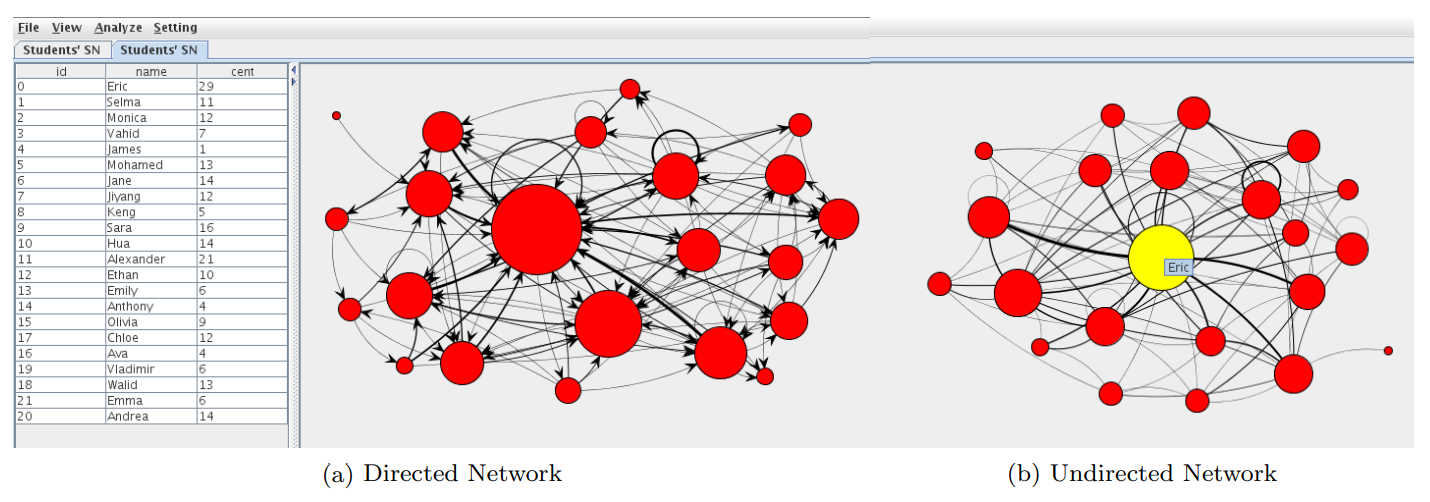
The above image shows us the social network of the interaction between students within the class. The size of the nodes represents the student’s centrality and leadership in the discussions and the width of the edges represents the weight of the communication between each student.
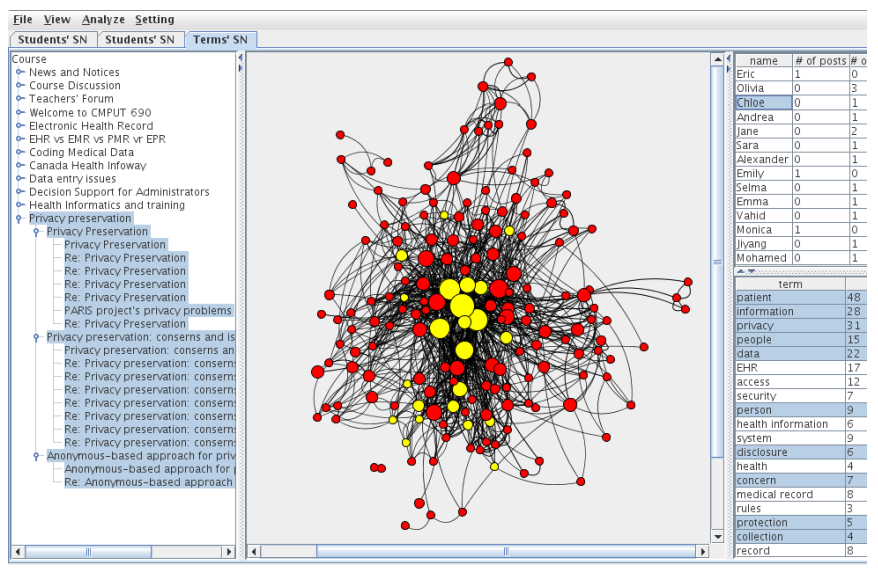
The above image illustrates a visualized term network, which focuses on the frequency of the terms within categorized term communities.
Conclusion
It’s very interesting to see how the choice of data used to generate a social network can create a huge impact on the results of the analysis. In this scenario, simply tracking the frequency of posts, for example, will not provide much information regarding the interaction between students, and doesn’t really track the topics or discussion terms very well, so the authors had to figure out other metrics to use to identify how to gather the correct type of data first before performing social network analysis. This allowed them to conduct a thorough analysis on the participation of students in online courses.
Sources
Mansoureh Takaffoli, Osmar R. Zaïane and Reihaneh Rabbany k.. (n.d.). Analyzing Participation of Students in Online Courses Using Social Network Analysis Techniques. Retrieved October 12, 2022, from https://webdocs.cs.ualberta.ca/~zaiane/postscript/edm11.pdf