tl;dr? Try visiting this link to try out the webapp I made, and then come back if you don’t understand what you’re looking at.
>>> https://spaulmark.github.io/project-lsg/ <<<
Background
Earlier this year, I collected real data from an anonymous Online Reality Game (ORG) where the primary mechanic is elimination by majority vote until only one winner remains. I put that data into an interface I made that lets you see how people’s relationships in the game changed over time.
These games take place on private online forums in which players can send private messages to each other, compete in online challenges, and cast votes to eliminate one another until a winner is declared. Every 48-72 hours, one or more players are voted out of the game. Games typically last 40-60 days. Throughout the course of the game, players were divided among many different subgroups (tribes). Communication was only allowed among members of the same tribe at any given time. Eventually (usually around 13-11 remaining), the tribes all merge into one tribe and remain that way until the game ends.
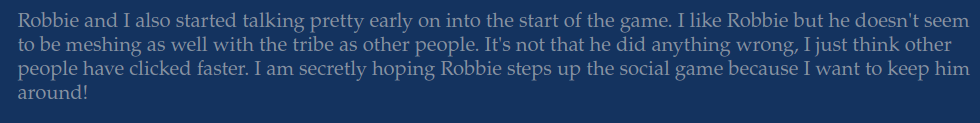
I signed up as a spectator, meaning I had access to all the boards of the game. As a spectator, I did not have access to the private messages that players sent to each other, but I did have access to private “confessional” subforums for each player, in which players were encouraged to post their thoughts and plans for the game.
Dataset
Over the course of the entire game, I monitored each confessional and kept track of players opinions on each other based on what they wrote in their confessionals.
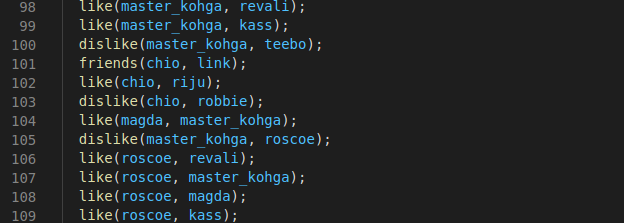
The dataset, as seen in the picture above, is a list of statements that can be used to construct a directed signed graph with players as nodes and relationships as edges. As players are voted off (or return to the game), special statements serve to delete or re-create the node as appropriate.
From this dataset, I used the constructed directed signed graph to model the relationships between players based on the sentiments they expressed in their confessionals. A positive edge (like) from A to B signified that A intended to keep B in the game. A negative edge (dislike) from A to B signified that A intended to eliminate B from the game. No edge from A to B meant that A either never expressed any opinion on B, or that A did not feel strongly about B.
Motivation
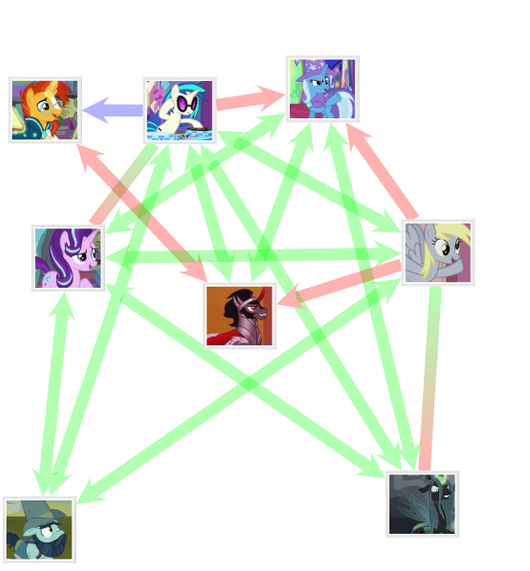
Analysis of a social network in an ORG is different than ordinary social network analysis. A spectator of the game is not only interested in the overall structure of the network, but also the individual relationships and social position of each player. Furthermore, because of the high social density of the network, simply drawing a graph, even for small tribes, is insufficient to communicate meaningful information about the game to spectators.
Please note that I had nothing to do with the my little pony theme of the game.
Some of the questions that a spectator may want to ask about a game are: Who is in a good position? What are the relationships of any given player? Who is likely to be voted out soon? Who will be voted out next? What major alliances (cliques) exist? What opposing sides exist in a tribe? Who is in a central or influential position?
In order to display the data in a way that can quickly answer the questions spectators might have, I made an interactive web app meant to address these questions.
Features

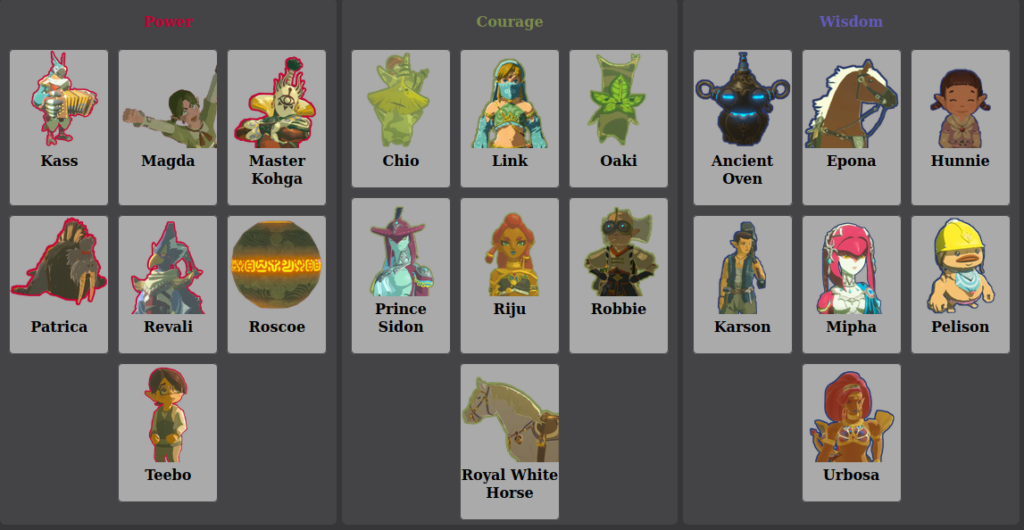
The number of people in the game who like or dislike each player is displayed under them at all times, making it easy to see who is at the top or bottom of the social hierarchy. You can also click on players to see their relationships.

Once players have swapped tribes, their old relationships are still displayed, though they may not be relevant to their current situation. To get around this, tribes can be viewed in isolation by clicking on their titles.

I also added an experimental feature that lets you select multiple people at once, and make it so only their opinions were displayed. This was intended to be useful for collecting the opinions of a group of aligned people to find common friends or enemies.

One issue with this feature is that it only shows the outgoing direction of relationships once at least two players are selected. From this sequence of operations, you can’t tell that Epona and Prince Sidon actually have a non-mutual relationship: Prince Sidon likes Epona, but Epona dislikes Prince Sidon.
Problems Solved
I was able to receive some feedback from the other spectators when I shared this with them. Given their feedback and my own opinions, I believe this interface is does a number of things very well. It is very easy to see which players are in a good or bad position based on the number of people that like or dislike them. The timeline slider also makes it easy to see how relationships changed over time, seamlessly adding a second dimension to the interface. Clicking on a player to view their relationships is also extremely useful as a spectator. All of the major features in this interface, aside from the multiple selection feature solve the problems they are intended to solve very effectively.
The multiple selection feature, as seen above, can give the user misleading information. Furthermore, it requires many clicks and lucky guesses to get a good picture of the overall tribe structure. Since you can only view one group at a time, this has a high cognitive load.
Problems Not Solved
This interface does not address all the questions a spectator could have. In general, it is easy to get detailed information on one player, or a general idea of the tribe hierarchy, it requires a lot of clicking and cognitive load to gain a complete understanding of the overall structure of each tribe, even using the group select feature. The logical next step would be to create an interface that can identify, display and compare (potentially overlapping) groups of players. Whether or not it is actually possible to create such an interface is left as an exercise to the reader.
This interface is also lacking some critical game information, namely vote counts and who voted for who each round. Also missing are individual players that were ineligible to be voted out each round. While this isn’t a function of the graph itself, it provides extremely valuable context to someone who has no prior knowledge of the game played (ie. you).
A careful observer may also note that on the first round, on the Power tribe, Magda was voted off, despite the data saying she had 3 friends immediately before being voted off, meaning she should have had enough votes (4/7) to keep her safe that round. The missing context is that the two vote options being considered as votes that round were Magda and Patricia, and Patricia was one of the players that liked Magda, meaning they were forced to vote for each other, and as a result, Magda was eliminated 4-3 over Patricia.
We can also observe the issue that players sometimes do not give information they deem to be obvious simply from reading their confessionals. On the Wisdom tribe, Karson was voted off unanimously, despite only having 3 out of 6 players say they disliked him in their confessionals. Throughout the game, there is a common issue of some some votes coming as a surprise based on the data, simply because some players don’t mention what is happening in real time in their confessionals. Examples: (Episode 4, Ancient Oven voted out; Episode 9, Royal White Horse voted out; Episode 11, Oaki voted out… etc.)
Incompleteness of the Dataset
As mentioned earlier, all data was manually collected by me. It is possible that I missed things from player confessionals or misinterpreted things I read. This incompleteness is further exasperated by the fact that some players chose to use their confessional far less than others (Epona, and Royal White Horse, to name and shame a few). Information volunteered by players in their confessionals is not even necessarily accurate, as some particularly paranoid or emotional players can flip flop back and forth between opinions, making it difficult to read their intentions, if they have any at all.
Conclusion
This interface is a good start. It solves some of the basic problems that spectators have. However, it is far from being a complete solution to the problem of visualizing the small, dense social networks we can observe in ORGs. Perhaps I will learn something valuable in this class that I can apply to this problem in the future.
Links:
The application in question: https://spaulmark.github.io/project-lsg/
Source code and README: https://github.com/spaulmark/project-lsg
Forum where the game was played [if you have never seen one of these before, you are unlikely to understand it]: https://powervcouragevwisdom.freeforums.net/