Secret Hitler is a deception game I enjoy immensely with my group of friends, and I particularly love it because it feels a little less random (and more rewarding) than other popular ones like Coup and Werewolf. Decision-making actually matters, and topics of this course including game theory, dominant strategy, and payoffs are highly relevant to the game, although payoff matrices are hard to make because much of the payoffs aren’t possible to quantify into exact numbers.
The rules are fairly long, so I’ll just summarize the ones relevant to this post (though the full rules are linked at the end). At the start of the game, each player is randomly assigned one of two possible secret identities: Liberal or Fascist. There is a slight majority of Liberals. Additionally, one player among the Fascists is “Hitler.” The Fascists know who each other are, but the Liberals don’t know anyone’s identity.
There is a deck of cards, and each card is Liberal or Fascist (all cards look the same when facedown), which represent “policies.”
At the start of every round, all players vote for a President and Chancellor. If the majority of players vote Yes, the vote succeeds. The President draws the top 3 cards from the deck, chooses one to discard, and passes the remaining 2 cards to the Chancellor. The Chancellor then picks 1 card to play on the board (discarding the other) – this is called “passing a policy” and is the end of the round. Although these decisions are not made simultaneously, there is no communication from the President or Chancellor until after the card is played.
The Liberals win if a certain number of Liberal cards are played, and the Fascists win if a certain number of Fascist cards are played. Fascists can also win if Hitler is elected Chancellor at any time after 3 Fascist cards have been played.
There are also special powers the current President gets if a Fascist card is played, when a certain number of Fascist cards are already on the board. This includes eliminating another player of the current President’s choice. The Liberals can also win if Hitler is eliminated from the game.
General Liberal goals:
Get Liberal cards played
Help Liberals identify other Liberals (to elect Liberal Presidents and Chancellor, who would pass Liberal policies, and to avoid electing Hitler)
Identify and eliminate Hitler
General Fascist goals:
Get Fascist cards played
Appear Liberal in order to get elected (since Liberals have a majority)
In this blog post, I’ll only be approaching game theory and payoff discussions from the perspective of Liberals players before any special presidential powers are available, for the most straightforward position possible.
If a Liberal President draws 3 Fascist (3F) or 3 Liberal (3L) cards, there’s no choice to be made.
If a Liberal President draws 2F1L, discarding a Fascist card is usually the dominant strategy, since you generally want there to be a chance for the Liberal card to get played by your Chancellor.
The controversial scenario appears when a Liberal President draws 2L1F. Both my friends and the unofficial strategy guide (linked at the end) recommend discarding a Liberal card and passing 1 Fascist and 1 Liberal card to the Chancellor, “testing” them with a choice. However, the linked sources claim that from a game theory perspective, the dominant strategy is to instead discard the Fascist card and hand 2 Liberal cards to your Chancellor. Here are the immediate payoffs for the Liberal President in this situation:
Strategy 1: Discard a Liberal card:
If the Chancellor plays Liberal
Goal 1: positive payoff
Goal 2: neutral payoff
If the Chancellor plays Fascist:
Goal 1: negative payoff
Goal 2: neutral payoff
Strategy 2: Discard the Fascist card:
Chancellor plays Liberal
Goal 1: positive payoff
Goal 2: neutral payoff
The argument made by these two sources is that the Chancellor playing the Liberal card, even if given a choice, doesn’t really mean they’re Liberal. Furthermore, if they play the Fascist card, the Chancellor will obviously claim that they were actually given 2 Fascist cards and did not have a choice (and claim you’re framing them). There’s no way to convince the rest of the players that you’re telling the truth and your Chancellor is lying. So, the Liberal President gets an equal or better payoff by discarding the Fascist card, regardless of the Chancellor’s choices (and in this case, denying the Chancellor any choice).
However, the payoffs get infinitely more complicated when not just considering immediate payoffs. For example, finding out your Chancellor is Fascist may give you a chance to eliminate them from the game in the future, or your vote could be the crucial tie-breaker in not re-electing that player (who you now know to be Fascist) to the position of President or Chancellor in the future. Furthermore, if you do have other players’ trust, you may be able to convince them that this Chancellor is indeed a Fascist, and you are the one telling the truth.
In real life, of course, players are not perfectly rational, and much of the fun of the game comes from heated discussions and vocal accusations. When I’m in this situation, as a Liberal president who draws 2L1F, I opt to discard the Fascist card and not give the Chancellor a choice. A large part of this is because I know that I’m not the most persuasive person. I would likely be put at a disadvantage by being in conflict with another player, so the safer option is just to guarantee that a Liberal card gets played and I don’t lose any perceived trustworthiness. Still, it’s somewhat satisfying to find out that at least from a simple standpoint, game theory seems to agree with my decision.
Information cascades are a fascinating occurrence, especially when it occurs in a free and public system in which one would assume that actions and reactions would be more randomized. One wouldn’t be faulted to think that since there are many variables and sometimes random failures or successes that the cascade would eventually stop or simply have a short life span. However a recent study “Finding Structure in Wikipedia Edit Activity: An Information Cascade Approach” gives another example of an information cascade on ironically the free source of free information in the world: Wikipedia.
Wikipedia is an inherently untrustworthy source as anyone is allowed to change information on any article or page. But in the same way this nature of being free and public changes it from an untrustworthy resource to a trustable one because so many different users including experts have verified the information. However, when a malicious, misinformed, or even valid actor changes a fact on Wikipedia there are information cascades that occur due to an initial update to a page which results in another page adopting the same information and so on and so forth.
The research team found interesting results regarding the cascade structure and properties. The study collected start from January 1st 2015 to March 31st 2015 from the English Wikipedia, the text that was changed, and by which user.
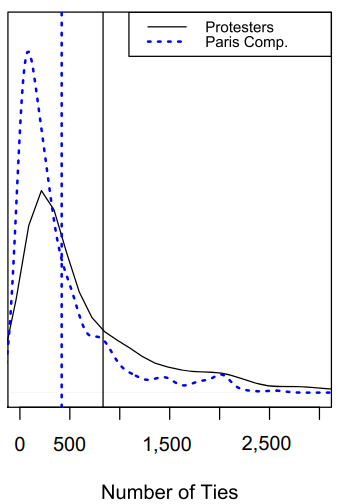
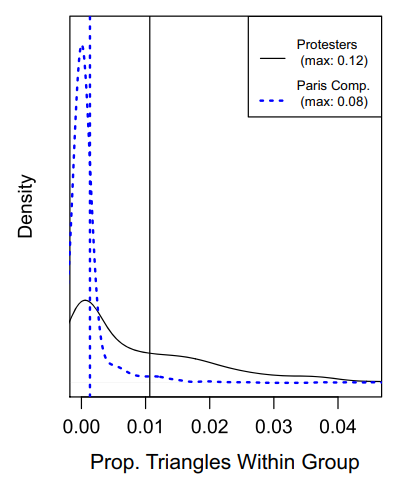
The size of the cascade was often small, the result summary states 13.7 as the average cascade length with the smallest being 2 and largest being 8068. The average duration of a cascade was also much closer to the shortest path duration than the longest. The implication of both a short cascade length and duration implies that these blindly trusted claims are not spread too far.
From this graph it can be said that information cascades on Wikipedia tend to form strongly connected components and are likely to group together based on the information benign cascaded. This makes sense as pages that share information are more likely to be related to one another.
This revelation can potentially be used by WIkipedia to stop or confirm that the right and accurate information is being spread. For example after a newsworthy incident happens many Wikipedia pages are likely to be updated, by using this sort of recognition Wikipedia can fact check and official support or prevent the information spread.
Evolutionary game theory is a branch of game theory that deals with evolving populations in biology. Evolutionary game theory approaches problems from a slightly different perspective than traditional game theory, so I’m going to highlight some of the differences. In evolutionary game theory, the players are presumed to be animals in a population. These animals don’t make rational decisions and instead stick to a pre-programmed strategy. This single hardwired strategy could represent a specific genetic trait of the animal, for example, the color of its camouflage or its behavior in certain social situations. Since the strategies are hardwired to the animal’s genetics, information at the time of the decision is not used or relevant. Payoffs in evolutionary game theory do not represent a preference for the animal, but instead Darwinian fitness, which is the expected reproduction capability the animal provides for future generations of the species.
A common example in evolutionary game theory is the game of hawks and doves. I’m going to describe a simplified version of this game as discussed in this excellent video. In the fictional world of birds, there is a finite amount of food that replenishes every day. The food appears in pairs of two. Every day the birds must fly out to find food to survive and reproduce. A bird can only visit one food source each day which is selected randomly, and there is a chance that another bird can arrive at the same food source. There are two strategies for the birds. The first is the dove, which shares the food even if it encounters another dove, but only takes a small amount and flees if threatened. The other strategy is the hawk. The hawk threatens for food if it encounters another bird. If it encounters a dove it gets the majority of the food, and if it encounters another hawk they fight, and both die. Here is the payoff matrix with blue representing doves, and red representing hawks.
When we simulate the world of the birds for many generations, the dove and hawk strategy always forms an equilibrium, where there is an equal amount of doves and hawks. This is because if your opponent is a hawk, then the best option is to be a dove. If the opponent is a dove, the best option is to be a hawk. It’s always an advantage to be playing the strategy that isn’t the majority. Due to natural selection, the two strategies always arrive at the same 50/50 equilibrium.
One of the primary concepts of evolutionary game theory is the idea of evolutionary stable strategies (ESS). An ESS is a strategy that if all members of a population played that same strategy, then there is no other strategy that would experience a better payoff than the original strategy. An ESS is stable because there isn’t a different strategy that could overcome it. There is no stable strategy in the world of birds. If all birds were playing the dove strategy the expected value of playing hawk would be better, and if all animals were playing the hawk strategy then playing a dove would be better.
The final topic of evolutionary biology I would like to discuss is the potential for altruistic behavior to develop. Imagine a world with a bunch of monkeys and lions. The lions periodically attempt to eat the monkeys. When a monkey sees a lion, there are two behaviors that the monkey can express. The monkey can go secretly hide, which guarantees its survival but causes another monkey to get ambushed and eaten, or the monkey can alert the other monkeys around him of the danger, which guarantees all other monkeys survive but puts themselves at risk, though they do still have a chance at survival.
In traditional game theory, an individual monkey should always go and hide, but in evolutionary game theory the monkeys don’t make rational decisions. Over hundreds of generations, due to natural selection, the groups of monkeys who alert others, risking their safety end up becoming the strategy, and therefore altruistic behavior becomes the dominant strategy in this world. Evolutionary game theory is an incredibly interesting subfield of game theory. It introduces interesting topics such as altruism, and has applications in many other fields such as economics, biology and memetics. I hope this post provided you with a simple introduction to EGT. I hope that I’ve sparked an interest in EGT and some of you will go on to do more reading and learning about the subject.
Cold War is one of the most controversial and darkest eras in history of humanity which lasted over 4 decades. Starting from 1947 an intense Arms race began between the two superpowers of the time, United States of America and the Soviet Union. This conflict spanned from subtle espionage in the biggest cities of the world to violent combat in the tropical jungles of Vietnam. Both countries were aggressively developing new nuclear weapons which were becoming more and more destructive as developments moved forward. It was in this era that one of the most important mathematical ways of modelling behaviour came in to play. You guessed it! Game Theory. Game Theory was a key component that both countries used in order to model the behaviour of the one another and come with the best strategy possible in response to the strategy one another, however Game Theory was not the only component that leaders of the world considered when they made their decisions at the time. We are going to explore what could happen if each country chose strategies with having minimal to no information about the decision of one another PURLY abed on Game Theory and Rational Thinking. Stay tight and you will find out how a simple matrix and Game Theory could end the life on earth forever!
During the cold war, USA and USSR were both ready and armed to teeth to get in a nuclear war with one another. “On September 26, 1983, Lt. Colonel Stanislav Petrov was in command at Serpukhov-15, a bunker where the Soviets monitored their satellite-based detection systems. Shortly after midnight, panic broke out when an alarm sounded signaling that the United States had fired five Intercontinental Ballistic Missiles, or ICBMs, toward Russia. The warning was a false alarm—one of the satellites had misinterpreted the glint of sunlight off clouds near Montana as a missile launch—but to the Soviets, it appeared the United States had started a nuclear war.” However, Colonel Stanislav Petrov trusted its instincts instead of acting rationally, and didn’t fire soviet nuclear missile and saved the world from a nuclear war close call. However, we would like to see what could happen if he would think rationally about the situation.
Figure 1: Colonel Stanislav Petrov, who saved the world from world war 3. Source: Wikipedia
This can be imagined as a game and can be roughly modelled with the tools game theory provides us. Imagine USA and USSR being two rational agents, and both assume that the other is thinking rationally about the situation. In this game setup both agents, USA and USSR, have two strategy that they can come up with in response to one another. Strategy one is: Attack, and strategy two is: Not Attack. Obviously either one of the countries (rational agents) choosing to Attack would start the third world war. Please note that in this era both countries considered one another a threat to the free world and wanted to eliminate each other. With that note in mind we assign pay off values to each strategy. Remember that payoff is a tuple of numbers which first coordinate represents pay off for first agent and second one represents the payoff for the second agent, in this example let agent one be USA and agent two be USSR. Payoff for coordinate AA of matrix (both countries choose to Attack) is (-infinity, -infinity). For coordinate AN (agent one chooses to Attack and agent two chooses not to Attack) is (1, -infinity) and for coordinate NA is (-infinity, 1). And finally, for coordinate NN (both countries choose Not Attack) is (0,0). And this is the game setup and components.
Figure 2: This is how payoff matrix would look like for USA and USSR during the Cold War.
Now, why did we choose the payoff numbers the way they are? well, the explanation is actually pretty simple, -infinity represents permanent elimination or taking TOO MUCH time to repair and revive the life in that are, 0 represents no destruction at all (Nothing changes), and 1 represents they gain a point for eliminating the thereat and it becomes the only superpower in the world. Remember, this is nuclear weapons we are talking about here so -infinity sounds about right for as payoff because if one country attacks the other it takes way TOO LONG to return to normal state for that country.
Now, how each county is choosing their strategy? Well, since both countries are thinking rationally, and both want to eliminate the threat the choose to Attack regardless of what the other country is choosing. The reason is because (1) if one country attacks the other, the other country will attack too, and (2) If one country attacks and the other one doesn’t that country becomes the only superpower and eliminates the threat at the same time (gains a point). Therefore, both countries choose to attack regardless of what the other chooses. Hence, we notice that both countries have a Dominant Strategy.
There is something wrong with the game above and it is that, coordinates NN (Both countries choosing not to Attack) is the best option for all people in the world and nothing would change, and peace would remain in the world. However, making decisions only based on Game Theory, never gets us to both countries choosing not to attack each other, but instead leads to AA (Both countries attacking each other), which is Nash equilibrium in this model, and that would end of life on earth.
Figure 3: Each blue box in the payoff matrix represents the dominant strategy for each country, and intersection of the two blue boxes represents the Nash Equilibrium of the game.
With all above being said, Colonel Stanislav Petrov would fire the missiles with the setup we gave, and world would be much more different than what it is right now. So, we explored what would happen if during cold war both countries made their political decisions purely based on Game Theory, and we can see that Game Theory alone could end the life and we wouldn’t exist right now if that happened! Considering all that said, you can go and enjoy your life and be happy that diplomacy is not only based on purely rational decisions, and leaders of the world look further and think about the future of the world and how it could look like before making a decision just like what happened in 1991 and both countries chose to come to peace at the end and save the free world that me and you are living in right now.
The fresh water supply in the world is limited and its demand applies to everyone. We use fresh water for agriculture and food production, which in turn helps provide sustainability for our living conditions. What would happen if countries were to fight for fresh water? We can investigate through game theory by creating game models to demonstrate how a country would act in accordance with other countries.
In the game model, we have two players and their strategies will be limited to two. What the strategies are will depend on the situation presented. We’ll see how the game models operate similarly to previously seen game models such as Prisoner’s Dilemma.
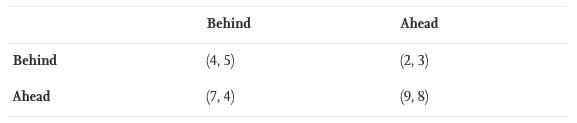
In an intra-country example, we consider two farmers extracting water for their crops. They are offered the choice of two aquifers, where the first aquifer has a lower pumping rate but lasts longer, while the second aquifer has a higher pumping rate but lasts shorter. There are only two aquifers, so in the case that both farmers choose the same aquifer, they must share it. Figure 1 shows the payoff matrix demonstrating each player’s utility in each scenario.
Figure 1
Here we see the familiar Prisoner’s Dilemma game model, where the dominant strategy for both players is the second strategy, even though the optimal cooperative outcome is the first strategy. This represents the real-world scenario where two parties can slowly share a water resource without depleting it versus quickly share a water resource and emptying it.
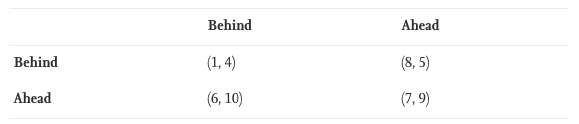
Another instance where game theory can be applied is the Iran-Afghanistan Conflict, where both Iran and Afghanistan depend on the Hirmand River for their agricultural needs. However the river must be maintained to sustain itself, so one or both of the countries must expend some cost to fix up the river. Here the strategies offered are to pay or not pay. Figure 2 shows the payoff matrix of such a game model.
Figure 2
Here we see there’s no strictly dominant strategy, however, we are able to establish two pure-strategy equilibria. These two equilibria involve the case where one country pays while the other does not, which correspond to (DP, P) and (P, DP). Intuitively, the country not paying gains the most amount of utility since they can enjoy the river while not sacrificing any costs. Furthermore, the country paying the cost may not receive as much utility but having access to the river is evidently better than not having access. There also exists a mixed-strategy equilibrium where both players choose to pay with p=1/2, which yields an expected payoff of 2.5. This scenario of the two countries show how water resources can benefit both parties, but only one might try to maintain the water resource.
These two game models do not show the full story, since if one country was more fortunate than another country, their utility payoffs can differ. For instance, if it was Canada and Iran as the players, Canada may have a higher payoff even if they were to pay the costs. This is because the costs can be viewed as negligible.
In conclusion, with fresh water resources being essential to agriculture, game theory has proposed some strategies countries can take. This will depend on the countries’ fortunateness and whether they adapt a cooperative or a non-cooperative stance.
If you have read my last blog post, you can skip this section. ORGs are Online Reality Games. They take place on private online forums in which players can send private messages to each other, compete in online challenges, and cast votes to eliminate one another until a winner is declared. Every 48-72 hours, one or more players are voted out of the game. Games typically last 40-60 days. Throughout the course of the game, players are divided among many different subgroups (tribes). Communication is only allowed among members of the same tribe at any given time. Eventually (usually around 13-11 remaining), the tribes all merge into one tribe and remain that way until the game ends. At the end of the game, two players remain, and a jury of recently eliminated players vote on who they think the winner should be.
It is also possible to sign up as a spectator, meaning you would have access to all the boards of the game. As a spectator, one does not have access to the private messages that players sent to each other, but they do have access to private “confessional” subforums for each player, in which players were encouraged to post their thoughts and plans for the game.
Going Beyond the Data
In my last blog post, I demonstrated a new interface for visualizing social networks in online reality games, and analyzed what it did well, and what it did poorly. I also discussed some of the limitations of gathering real data from such games, namely that players are not guaranteed to volunteer complete or accurate information, due to the stress and complexity of the game being played.
Because of these limitations, the resulting interface I created ended up not being a tool that visualized the social network, but rather a tool that visualized an approximation of the social network. This observation naturally leads to the question: What would a tool to visualize the actual network of the game look like?
Introducing Big Brother Bots
A first look at the game, featuring a cast of characters from the fire emblem series.
In order to further look into this problem, I created the webtoy Big Brother Bots, or BB-bots for short. Big Brother is a game in which players compete in challenges for power in the game, and eliminate each other one by one by majority vote. When only two players remain, a jury of previously eliminated players vote on who they want to see win. Each round (Week) of Big Brother is split up into 5 phases. In the Head of Household competition, a player is randomly selected to win Head of Household. The same player cannot win this competition twice in a row, unless there are only 3 players remaining.
Selena wins Head of Household.
The Head of Household (HoH) will then nominate two players for eviction. Players nominated for eviction are at risk being voted off.
Selena nominates L’Arachel and Dorothy for eviction.
The players nominated for eviction will have a chance to save themselves by playing in the Power of Veto competition. The Head of Household, the two nominees, and three other random players will have an opportunity to win the Power of Veto (PoV), which enables them to veto one of the nominees. They can also choose not to use this power. In the game, the winner is chosen randomly.
Marcus wins the Power of Veto.
If the power of veto is used, the Head of Household must name a replacement nominee. The winner of the Power of Veto cannot be named as a replacement.
Marcus saves his friend Dorothy from being nominated.Selena names Oswin as a replacement nominee.
At this point, all the players in the game, except for the Head of Household and the nominees will cast votes on which of the two nominees they want to see eliminated from the game. The Head of Household only votes in the case that they need to act as a tiebreaker.
Oswin is evicted from the game.
This repeats until only two players remain, at which point a jury of recently eliminated players votes on a winner.
Spoilers: Glen is crowned winner of Big Brother.
Social Network Model
Viewing the relationships of Glen, Marcus, and Lugh. Note that all relationships are mutual.
The model for the relationships in the social network is a complete undirected graph with edges of uniform random weight in between -1 and 1. This is then displayed as a number between -100% and 100%, and does not change throughout the game. The little cards generated for each player contain a lot of densely packed information. Here is a summary:
Popularity is the average of a player’s relationships, and dictates the background colour of the card. This gives an immediate visual indicator of generally how well liked a player is. HoH/PoV/Nomination counters are self explanatory and not related to networks. The number next to the target emoji counts the number of players in the game that would nominate Wolt this round if they won Head of Household. This gives a good indicator of how much danger a player is in. Friends and Enemies are calculated in a different way.
Examples of friends and enemies.
Friends and Enemies are relative to a player’s popularity. If the relationship between two players is less than each of their popularities (ie. worse than average), they will be enemies. If the relationship between two players is greater than both of their popularities (ie. better than average), they will be friends. The intuition being that a friend is someone you treats you better than average, and an enemy treats you worse than average. It is also possible for there to be a one-sided relationship, which is called the pawn/queen relationship (named after chess).
An example of a pawn/queen relationship.
In this example, Caellach’s relationship with Dorothy is better than average for him, but Dorothy’s relationship is worse than average for her. This leads to a one-sided relationship between the two of them.
One may wonder why it is necessary to have relationships be tied to popularity. The reasoning for this is thus. Big Brother is a game that ends with only one winner. If six players formed a coalition and successfully eliminated every other opponent, they will be forced to turn on each other when there are six players remaining. At this point, a coalition of six makes no sense anymore, since every coalition, by nature of the game requires a common enemy. The nature of this model is that as enemies are eliminated, weak friendships break down, and as friends are eliminated, weak enemies put aside their differences. Behold an example from the game:
Caellach loses his friendship with Dorothy, before being evicted in week 9.
Between Week 7 and Week 8 of the game, Dorothy’s enemy Selena is evicted. Since the relationship between Dorothy and Selena was very extreme (-86%), Dorothy’s popularity was skewed downwards. Once Selena is gone, Dorothy’s popularity goes above -9%, and her relationship with Caellach becomes one-sided.
Criticism of the Social Network Model
This is not a realistic model of a social network. It should be quite easy to come to this conclusion based on the fact that all the relationships are uniform randomly generated between -1 and 1. Real social networks, as seen in class, tend to have clustering and communities. Comparing the random data from this model to the real data from the game I spectated confirms this hypothesis.
Real Data (Final 7). Note the presence of more friends due to clustering. (Urbosa, Epona, Ancient Oven)Fake Data (Final 7). Notice that there are far more enemies due to the requirement that friends must be “better than average”.
It is also worth noting that due to the “winner take all” nature of ORGs, the properties of real data from these networks does not necessarily match the properties of real data from real social networks. This is discussed in a different post, but it is worth bringing up again as a segue into the next topic.
A Game Within a Social Network
As the name might suggest, an Online Reality Game is a game. While the nature of the game encourages the building of social relationships, the win condition of Big Brother is to be one of the last two players standing, and convince a majority of the jury members to vote for you as the winner. And not all players are created equally. It is an observed phenomenon in past reality shows of the same nature [Big Brother 22 Spoiler] that players that had a lot of positive social connections are more likely to win over the jury at the end of the game. Sometimes, players will realize this, and backstab their more socially connected opponents as it gets close to the end of the game. I was able to observe this exact phenomenon in my real data, in which the best connected players early on (Kass, Epona, Prince Sidon) all had their connections rot away near the end of the game, where they were voted out in 8th, 6th, and 5th place respectively.
Early on in the game. Prince Sidon, Kass, and Epona are standouts for having the most friends.Final 6. Compare the amount of friends these players have in this image to the previous image, and note the inversion of power.
Players can deduce who they have a better shot at beating in the finals, so they try to get to the end with these people. They also know who would beat them in the finals, so they work to take these people out before it gets too late.
Jury in Big Brother Bots
The algorithm for deciding a jury vote in BB-Bots is very simple. Each juror votes for the finalist they have a better relationship with. This mirrors the observation that more connected players have a higher chance of winning at the end of the game. Since relationships in the game don’t change, it is easy to compute the results of every single possible finale and display the results to the user. This metric is referred to as Power Rankings.
A clever observer will realize that this is a special form of a graph, called a tournament. Every matchup of two players has a winner and a loser, so a directed graph can be constructed by drawing from the winner to the loser in every matchup.
The tournament graph for the Final 6. Note that tournaments are not necessarily transitive.
The introduction of this structure dictating who wins the game presents an interesting dilemma for players. Wolt will beat everyone except for Glen, so he needs to vote out Glen sometime before the end of the game. But if Wolt votes out Glen, everyone left in the game loses to him, and thus, he risks being voted out next. Gale is on the other end of the spectrum, where his only win condition is to get to the end of the game with Lute, but can vote out anyone else in any order.
It is a bit easier to understand see the ideas behind this game when the tournament is transitive. Lute is voted out next, and the game looks like this:
The name of the game is: “Eliminate Everyone to the Right of You before Final 2”. Gale cannot win this game.
Since Gale no longer has a chance of winning the game, he instead makes decisions entirely based on relationships, opting to vote off his enemies and protect his friends. Glen also plays entirely based on relationships, since he too is indifferent of who he goes to the end of the game with, the difference between them being that Glen always wins and Gale always loses. This “blog post” is already almost two thousand words long, so I will leave some questions as an exercise to the reader. Can any two players in the above game form a coalition where neither of them have incentive to betray each other? Can any three players in this game form a coalition intending to eliminate the other two first, where none of them have incentive to betray each other? Since relationships are not given, you can assume them to be anything you like in order to satisfy these conditions. Just make sure to state what you are assuming the relationships to be. I look forwards to the comments this will surely receive.
Criticism of the Jury Model
While this model does a decent job of imitating reality, an observer of a game may complain that it is uninteresting to see a player who has zero chance of winning be allowed to remain in the game. This can be partially remedied by changing the way the jury votes work. Instead of having the jury votes be given out deterministically to the finalist with the highest relationship, perhaps instead the juror will simply be *more likely* to vote for the finalist they have a better relationship with: with the exact probability being determined by the difference in their relationship with the finalists. This may still lead to a scenario in which one player has zero chance of winning. How this might be possible is left as an exercise to the reader.
Conclusions
By creating a simple model of an ORG social network, it is possible to learn more about ORG social networks and gain insights about how they can better be analyzed and understood. Even with unrealistic relationship data, the nature of power rankings data can be better understood.
My next goals in this project are as follows: First, to implement the non-deterministic jury vote algorithm described earlier in the post. Then, to make relationships more realistic, and use a model that can dynamically change and meet clustering and community requirements expected of an ORG social network as the game shrinks. I predict that further options for visualizing the structure of the network will open up once the social network generator is conforming to a realistic model.
This year, Paul Milgrom and Robert Wilson have won the 2020 Nobel Economics Prize for their important contributions to auction theory and inventions of new auction formats that we are using today.
Now let me introduce auctions with some examples:
Let’s say you know that a burger usually costs $10 at McDonald’s, and you are very hungry at the moment. But would you go to MacDonald’s and directly tell the cashier that you are willing to pay more for a burger since you are hungry? No. Because your hunger is private information to you only, you would rather get the food at the regular price.
What happens if this time you are the food seller? Would you ever tell the customer the minimum price of a burger you are willing to sell when you know it will sell more than the minimum price? You wouldn’t. Because that’s private information to you again.
A classic situation of an auction happens when you are competing with several other buyers, then the seller would prefer to sell the limited item to the buyer with the highest bid. Under this situation, each buyer will gradually reveal his/her highest private value that he/she is willing to pay to win the auction item.
Simplified payoff matrix of license auction
Private information makes auctions interesting. From the perspective of game theory, no one would know the exact payoffs from the strategies that bidders made since the private values are very subjective to each of the bidders. So, what should bidders do? With the question in mind, Milgrom and Wilson started the research to analyze how different bidders behave strategically when they each have access to different information during auctions. In 1969, Wilson recognized that the Nash equilibrium concept would permit an analysis of auctions with common value, meaning that part of the auction item’s true value is equal to all potential bidders while having the other part as the different private values.
Private and common values in auctions also lead to a well-known phenomenon called “the winner’s curse”. That is, the winner wins the auction only when his/her bid is higher than anybody else. This indicates that the winner’s bid may exceed the true value of the item a lot which ends up in a loss on the transaction.
Therefore, how to make a wise choice in an auction that balances the risks and the probability of winning the auction is always a challenging topic. And hopefully, with the knowledge of game theory, we can find out the best strategies in every “auction” in our life.
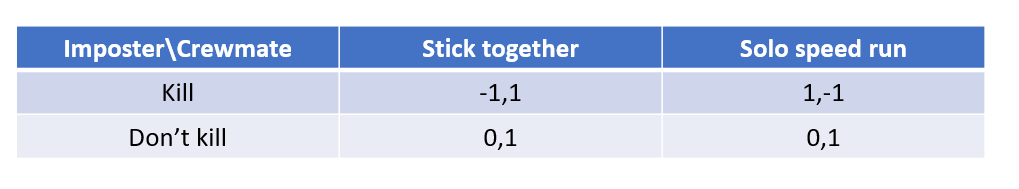
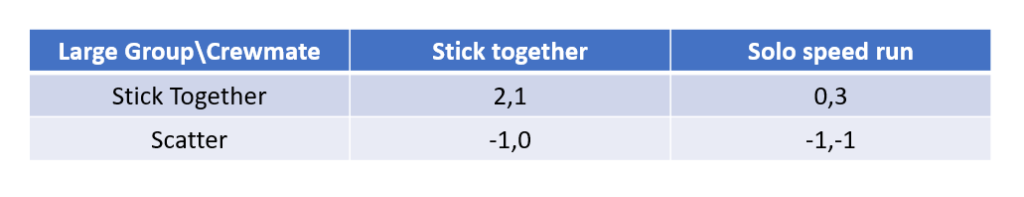
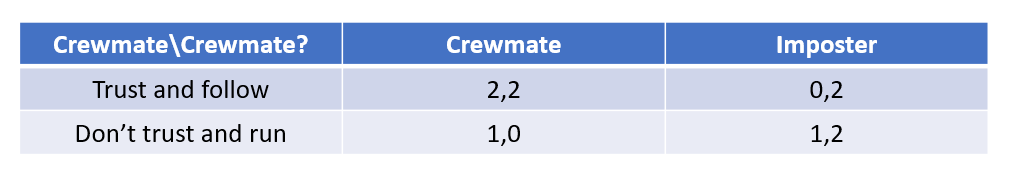
The multiplayer game Among Us has become widely popular over the last few months. The game is set on a spaceship where individuals are required to complete some number of tasks to keep the ship moving toward its destination. However, among all of the crewmembers lies an impostor, whose goal is to kill everyone on board the ship. The impostor must attempt to fit in alongside the other crewmembers by pretending to complete tasks or stay hidden and slowly kill individuals one at a time. When an individual has been killed, if another individual finds the body, they can report the body or if they find someone acting suspicious, they can hold an emergency meeting, where the individual who started the meeting must explain what they believe happened.
The emergency meeting is a perfect example of a simple herding problem as discussed in class. The individual who hosted the meeting has some reason to suspect another member on board is the impostor and must explain to all the other individuals who the impostor is and why. After presenting their case, the group has the chance to discuss their findings and either vote someone to be kicked off the ship or to skip the round of voting if insufficient evidence is found. When the host of the meeting describes the situation, they immediately begin to influence the other individuals into believing the person being accused is an impostor.
The other individuals can take what has been presented to them into account as well as their own experiences as they attempt to make a decision. For example, let’s say Player A holds an emergency meeting, accusing Player B of being the impostor since he saw Player B standing around pretending to do tasks and following him around suspiciously. After Player A makes their statement, Player B begins to defend themselves, stating they were looking for their next task. Now, after both players have spoken, a third player, Player C, begins to describe how she agrees with Player A and did notice Player B act oddly. When it is your turn to speak you can evaluate whether Player B is the impostor by seeing whether your experiences AND what Player B and C are saying make sense or if what you experience does not align with their story, an example of Bayes Law as described in class. This is very similar to the example of the blue & red urns. When it your turn to declare which urn is which, you evaluate if your experience (the colour you saw) AND the experiences of the students before you, make sense.
If enough individuals begin to vote to kick Player B, even if your experiences lead you to believe otherwise, you will assume that everyone else is telling the truth and vote Player B out too. Similar to the sidewalk experiment conducted by Psychologists, Stanley Milgram, Leonard Bickman and Lawrence Berkowitz. They found that if a single person on a street corner began to look up at the sky, some pedestrians would look up too, to see what they were looking toward. If they put 5 people in the spot, this quadrupled the number of people who looked up at the sky and if they put 15 people at the corner, 45% of pedestrians looked up alongside them. This goes to show that as more people conform to a single idea, it is much more likely for an individual to follow suit so as to fit in with their peers and not seem like the odd one out. With respect to the game, if an individual doesn’t conform to the ideas presented if everyone else decided to vote a single person out, they may seem suspicious themselves and leave others questioning if they are the impostor.
During one of our recent lectures, we were introduced to Game Theory and the modelling of simple two player games in a 2 by 2 matrix that consist of payoff values which sometimes vary depending on not just the decision the player chooses, but also depending on what the opposing player chooses too. This topic is a good way to explain the current climate change situation through various scenarios.
The bottom line and perhaps obvious reason why countries are slow in the reduction of carbon emissions and introducing policies to the benefit of the environment is because exploitation is profitable. At the present, from an economic perspective, using the resources we have provides the most individual benefit to its own nation. Thus even if two states or nations X and Y cooperate right now, looking at it individually there is more to gain from exploitation.
However sometime in the foreseeable future this will stop being the case. Near the collapse of our ecosystem, perhaps when we are seeing many heat storms or hurricanes or some other indicator, the priority of X and Y will now be protecting the environment. Exploitation now becomes a very unattractive option, as the need to sustain our ecosystem is critical for the survival of our planet. The other change is now that we are looking at things from the perspective of the whole ecosystem, X and Y will benefit, even if only X acts in the interest to protect the environment, since climate change is a global phenomena.
Yet, the above figure does not accurately portray both sides of the equation where there exists both the gain keeping the environment safe, but also the cost of passing environmental laws and the scenario where one nation benefits “freeloading” off of another nation enacting their policies. Let us create a scenario where the nations are the United States and China, where the situation is already at 10 point deficit. The benefit of one nation enacting policies is +3 to both nations as the environmental benefit, yet let’s say the individual nation’s cost to enact the policy is even greater at -4. We end up with a scenario like below.
T.L. is -10+3+3 for both countries since they both benefit from each other due to the environment getting better, but then go back to -4-4=-8 due to the cost of enacting their own policies.
D.L. and T.R. however have one of the nations getting the -10+3=-7 environmental benefit of the other nation without having to pay the -4 since they did not enact any policies while the other nation has a net negative with gaining their own environmental benefit but losing out due to their own cost of -10+3-4=-11
D.R. remains unchanged since neither nation enacted any policies
Thus, we can end up in a scenario where even though the best option overall looks to be the countries working together, individually it always make more sense trying to defect and not help the environment instead as the dominant strategy. This scenario mirrors the Prisoner’s Dilemma and it might be an ongoing scenario realistically between nations for many years to come before the cost of our environment will outweigh the cost for the nation to pass the environmental laws.
These are all hypothetical scenarios of course and many other factors and costs and payoffs are realistically put in to play, but it was just a simple model showcasing what may be a realistic payoff model that would continue to deter countries from trying to fight against climate change. Hopefully, nations come to some incentive to fight for climate change earlier than later and come to a solution before we are lead to the collapse of our ecosystem.
Sources: II, V. (2020). Is Climate Change a Prisoner’s Dilemma or a Stag Hunt?. Retrieved 20 November 2020, from https://www.theatlantic.com/notes/2016/04/climate-change-game-theory-models/479340/
Highfield, R. (2020). Climate change will get a whole lot worse before it gets better, according to game theory. Retrieved 20 November 2020, from https://www.wired.co.uk/article/climate-change-prediction-game-theory-tragedy-of-commons
Evolutionary Stable Strategies are behavioural strategies that if adopted by all individuals in a population then it cannot be replaced by a different strategy through natural selection. I was very fascinated by an article that explores how evolutionary stable strategies develop within a population over the span of generations using Game Theory and can help understand why it is important to help others for our own long-term survival. Moreover, the article also touches on concepts of Game Theory discussed in class such as payoff matrix and shows the implications of cooperation.
The articles observes two organisms that have a mutually beneficial relationship and develops a payoff matrix . Legume (bean plant) depends on bacteria that lives within the plant for nitrogen that the plant can use for photosynthesis to produce more sugars and the bacteria relies on the plant for energy in the form of sugar. If both organisms cooperate, they both can benefit creating a positive feedback for cooperation. The payoff matrix defined for the interaction is defined below:
If an organism cheats, the benefit in the next interaction is reduced by modifier value (m) – result for cheating. Whereas, if both organisms cooperate, their benefit is increased by (m) in the next interaction. Modifier values in payoffs can greatly impact behaviour allowing organisms to cooperate for better results.
The image on the right shows that even though only ~25% of the population of organisms were cooperating at the beginning, that quickly jumped to almost the entire population over the span of 1000 generations of both organisms showing the power of payoff modification in developing Evolutionary Stable Strategies if the partners honestly reciprocate cooperation from the other organism.
Game Theory provides us a framework to understand evolution of complex biological interactions across multiple generations and explains tendency for altruistic behavioural strategies like a bird providing warning call to other birds temporarily putting itself in danger and hoping that other birds will give it a warning call in future of an immediate threat – therefore it prepares to be at a disadvantage for a short amount of time hoping it will improve the bird’s chances of survival over its life span. Therefore, Game Theory helps to demonstrate that evolution of cooperation is necessary for long-term survival.
The biggest fear Earthlings face about sending messages and signals to exoplanets is to attract a more advanced civilizations who has evil intentions to destroy us.
Eamonn Kerins at University of Manchester talked about how we can use game theory to determine a way to detect and communicate with alien civilizations. The idea in Kerins approach is to detect mutual detectability. This means we want to search for alien like where the aliens would have a similar chance of seeing us. According to Kerins, mutual detectability is a game theory approach to increase the chance of communication between two alien civilizations. It might be possible that both the parties might not exchange the same kind of information, and also that the exoplanets might not be looking for the information that we exhibit. Therefore the best way to search is to let the exoplanets search for the information that we are looking for as well. Kerins calls this “common denominator information.”
Now that we and exoplanet have found each other, the game theory suggests that the party with the most common denominator information should make the first move in communicating with the other. For ex. we have detected that star K2-155 has a planet in its habitable zone. However, K2-155 is more luminous than Earth, so we can see them but they might not be able to see us very clearly. Therefore, we should make the first move in communicating with them since our CDI is bigger.
In the lecture, we have learned game theory which helps to make a smart decision about the most beneficial move that a player should make. Here, in this case, we are also using the same strategy to make a decision about how to find an exoplanet and which party making the first contact would be beneficial.
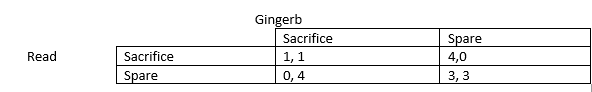
The holiday season is just around the corner. Everyone loves spending time with their friends and families doing fun activities like cooking and watching movies. Gift exchanging games is a fun activity that many do during the holiday. With any gift exchange, the real goal is to win the best gift.
The payoff matrix below represents a normal gift exchange between 2 people. E represents the enjoyment the player feels when they get a gift. C represents the cost of the gift the player gives. As we learned in class, we can apply nash equilibrium to see that both players will choose to receive, as it’s the dominant strategy for both players. Assuming the enjoyment is greater than the cost, the payoff is like the prisoner’s dilemma. So there is no winning here.
White Elephant gift exchange, also known as Yankee swaps is a variation on Secret Santa. Everyone brings a wrapped gift to the party and leaves them in the middle. Then everyone is given a random number which is the order in which everyone picks a gift. The first person picks a gift and opens it. The player after then makes a choice to either pick another gift and open it or steal a gift that has already been opened. If the player decides to steal the gift from someone, then the player whose gift got stolen will have a chance to steal another gift or choose a wrapped gift. A player can’t steal a gift that just got stolen from them and a gift can only be stolen a certain number of times. This gift exchange finish after all players have played and all gifts are opened.
The best scenario would be to go last, so if you want to steal you have the most variety of gifts to choose from. However, you don’t get to choose the order you play, but you can always pick the best strategy. Ben Casselman used basic game theory questions (such as Should you always steal? Never steal? Steal only under certain circumstances?) to come with steps to get the best gift. He tested the following 8 strategies:
Player steals with probability p = (number of gifts taken) / N (naive).
Player always steals most valuable gift available.
Player always steals second-most-valuable gift available (if only one gift is available, player steals that one).
Player never steals.
Player steals if any stealable gift has value (to them) greater than the mean value of all opened gifts.
Player steals about-to-be unstealable gift (steals == max.steal – 1) if one is available with a value greater than the mean value of all opened gifts.
Same as #5 but factor in knowledge of the gift the player brought.
Player steals if best available gift has value > expected value
Running the model resulting in the follwoing:
Using that result, Ben came up with the following step for the best strategy:
As each gift is opened, mentally assign it a value (perhaps a dollar value or a 1-to-5 ranking);
When it’s your turn, average the value of all the opened gifts (whether or not they’re available for stealing);
If there is a stealable gift “worth” at least as much as the average, steal it! Otherwise, open a gift. (Depending on the rules you’re playing by, not every gift might be available for stealing.)
As we see the upward trend of daily cases in COVID-19 there is also a proportional upward trend in the overload of paperwork in the health care system. More people are needed to be kept track of and hence there is a exponential amount of growth in available data. Once we reach a certain threshold of data gathered, it simply is not possible for humans to use all of the data to perform analysis on top of. Hence, the usage of artificial intelligence and computers become essential to perform heavy analysis. Maithra Raghu, PhD student at Cornell CS and Google Brain has been doing extensive research into this matter and wants to leave the the focus on data to computer scientists so doctors can focus on their patients instead.
Raghu has proposed to use neural networks to perform analysis on vast amounts of information and help health experts find patterns that human eye cannot pick up. We can further use these patterns to help diagnose and predict much earlier than if we were to use human effort. More importantly we can have more hands helping patients fighting the disease than having them go through paperwork that can be taken care of by computers.
High-resolution map of brain connectivity published by Google Brain
Using these amazing technologies such as neural networks to help solve COVID-19 is only one of the great example of how powerful and useful network analysis and neural networks are. Google Brain was able to use large amounts of data on brain to create a 3D model that traces 20 million synapses connecting more than 25,000 neurons in the brain of a fruit fly. It is estimated that human beings only use 10% of their brain’s capacity, with the advancements of neural networks and network analysis, I believe we will be able to better understand the human brain and access higher usage of the brain.
In conclusion, I believe the work on neural networks is really interesting and is being used mostly everywhere in the tech industry (Apple Silicon). I also believe it will play a big role in data analysis and help us solve problems which are simply unsolvable with human effort. Computers will help us become smarter and reduce tasks which it can do it better and faster than us.
References
Chen, J. (2020, November 13). A Google Brain scientist turns to AI to make medicine more personal. Retrieved November 20, 2020, from https://www.statnews.com/2020/11/16/google-brain-maithra-raghu-artificial-intelligence/
Vincent, J. (2020, January 22). Google publishes largest ever high-resolution map of brain connectivity. Retrieved November 20, 2020, from https://www.theverge.com/2020/1/22/21076806/google-janelia-flyem-fruit-fly-brain-map-hemibrain-connectome
In class, the prisoner’s dilemma was brought up to get an idea of how dominant strategy works. The prisoner’s dilemma has been shown to pop up in the real world, for example in arm races between countries and the overfishing problem; it’s easy to see why even though there is an optimal solution for both parties, the net result is one where both parties do worse. However, this issue is not just isolated in reality and I realized that similar social dilemma often arises in video games, specifically in multiplayer games.
The main reasons why many people play video games is to have fun, for the competition, or a little bit of both. However, even if you enjoy playing a game for fun rather than for competition, more often than not you will find winning much more enjoyable than losing. In many games, the most fun way to play will not be the most reliable to obtain a victory. This leads players to a dilemma in which they have to decide which strategy to pick that will counter the strategy picked by the opposing team. While competitive strategy can still be just as enjoyable as non-competitive strategies, there are times in games where the best strategy does not result in a fun time.
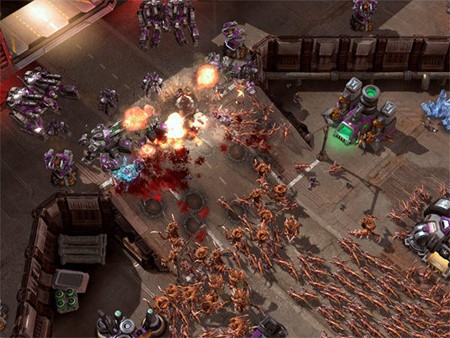
Online multiplayer game developers have the job of having to constantly patch a game even if there are no visible bugs. This is due to the fact that a multiplayer game that stays consistent and unchanged will grow stale and slowly lose its player base. To remedy this problem, developers will add new content to the game and make small adjustments that can change the meta in small or big ways. Unfortunately, sometimes the changes in the meta of the game are big and result in a less fun meta whether or not the developer intended for this. For example, “in the early days of StarCraft, a strategy called “Zerg rushing” emerged where at the beginning of the match players would quickly build lots of cheap Zerg units to overwhelm opponents before defenses could be constructed” (Madigan 2010). Before developer patches, this was the dominant and most used strategy of the game, even if it was not fun to play as or to play against. The prisoner dilemma perfectly explains why players kept using this strategy even though it was not every enjoyable.
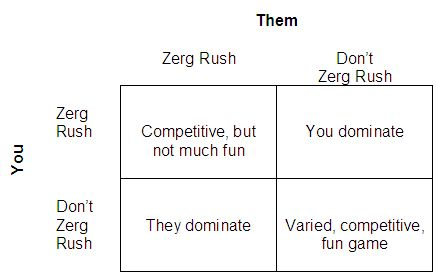
Example of a Zerg rushZerg rush pay off matrix
From the matrix above, one can see why Zerg rushing became so common. The dominant strategy for both sides is to Zerg rush and is a strategy that is strictly better than all other options, regardless of what other players do. While a game where neither player Zerg rushes would be ideal, if one player chooses not to Zerg rush, the other player will have more incentive to Zerg rush since they would have more enjoyment dominating the game than they would in a normal match. As a result, both players Zerg rush and the games are unsatisfying to play.
Another issue that comes from developers patching a game and adding new content is the inevitable bugs that come along with that content. Sometimes these bugs and glitches will be small and not usually have much impact on the game, but there are times when exploiting these bugs is a legitimate strategy that results in a more likely victory. For instance, “some players of the online first-person shooter Modern Warfare 2 discovered what became known as “the javelin glitch.” Someone, somewhere, somehow figured out that through a bizarre sequence of button presses you could glitch the game so that when you died in multiplayer you would self destruct and murder everyone within 30 feet, often resulting in a net gain in points” (Madigan 2010). Modern Warfare players end up in a similar dynamic as the Zerg rush problem where they have to decide which strategy will result in a more positive outcome.
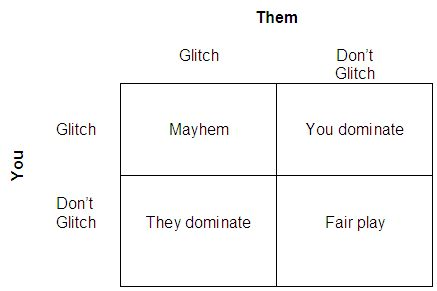
Example of Javelin GlitchJavelin Glitch pay off matrix
Once again, even though not exploiting the glitch would result in fair play that is optimal for both parties, instead the more common route was mayhem where all players exploited this glitch. This was so common in fact that Infinity Ward had to rush out a patch to stop it from being exploited any further. Using the same logic as the prisoner’s dilemma we can see that the dominant strategy for all players would be to glitch. The players would rather have a broken match than be dominated by opposing players.
In conclusion, the prisoner’s dilemma and game theory allow for a better understanding of social dilemmas in not just the real world, but also the virtual world. I believe that game developers at the very least can use this information to prevent players from having to be put in future dilemmas, such as by banning players that exploit bugs so that the pay off matrix will result in a dominant strategy that is fun for all players.
Sources:
Madigan, J., Says. (2013, July 30). The Glitcher’s Dilemma: Social Dilemmas in Games. Retrieved November 18, 2020, from https://www.psychologyofgames.com/2010/03/279/
With recent advancement in cryptocurrency, the profit of selling cyber tools and initiating attacks becomes much desirable. And thus led to new pathways for cyber hacking and cybercrime. According to the Center for Strategic and International Studies the estimated annual cost to the world-wide economy from cybercrime is more than $400 billion with a conservative estimate being $375 billion in losses, exceeding the national income of most countries.
In this paper, the authors develop a game theory model consisting of sellers and buyers with sellers competing non-cooperatively in order to maximize their expected profits by determining their optimal product transactions as well as cybersecurity investments.
This paper is on economics of cybersecurity in terms of information asymmetry: not assuming that the sellers are identical nor are they faced with the same cybersecurity investment cost functions. This paper particularly:
Develop a rigorous framework that captures competition among sellers in an oligopolistic market of non-identical sellers, who identify optimal product quantities as well as optimal cybersecurity investments;
For the first time, model information asymmetry associated with cybersecurity investments between buyers and sellers of a product;
This model is not limited to specific functional forms for the seller transaction cost functions and the buyer demand price functions.
This framework is computationally tractable and supported by both theoretical qualitative results and an algorithm, which enables the exploration of numerous sensitivity analysis experiments.
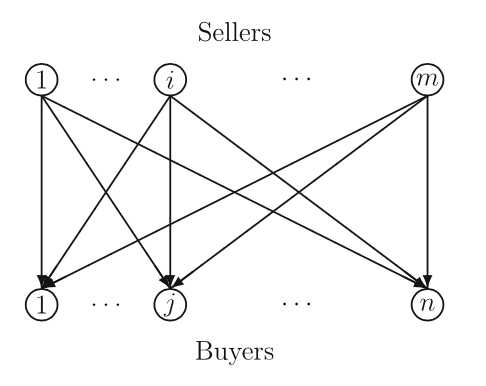
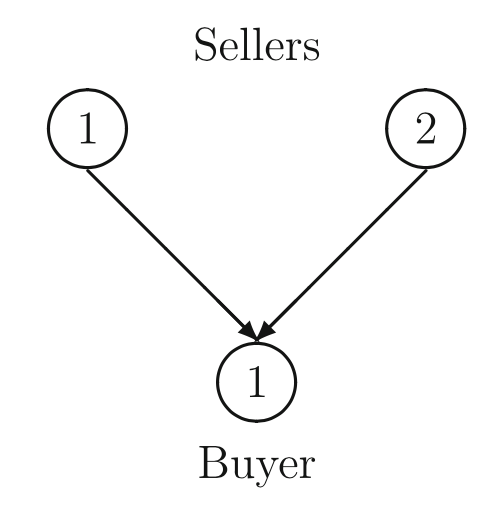
Here is the generic seller-buyer model used in this paper.
The generic network structure of the game theory model
They construct probabilities from the security levels of the sellers, identify the expected financial damages, in the case of a cyber attack, and reveal the expected profit functions of the sellers. The sellers compete non-cooperatively, each one maximizing his expected profit until a Nash equilibrium is achieved.
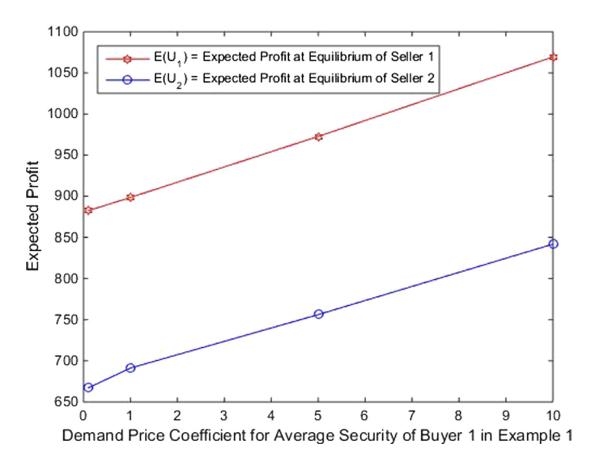
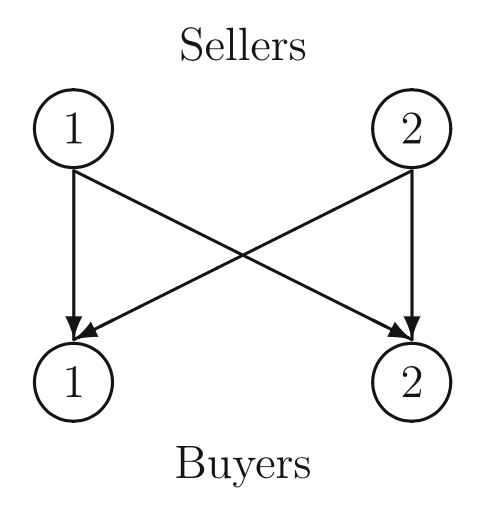
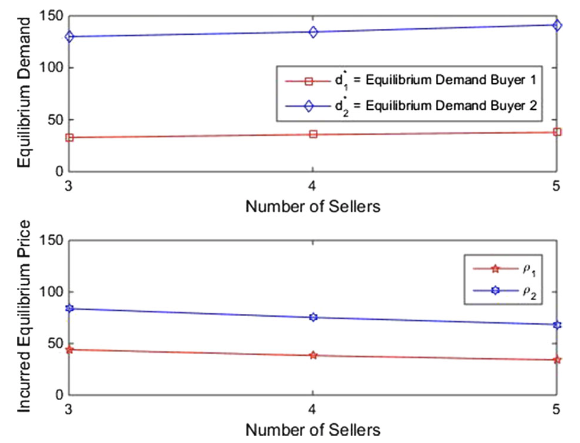
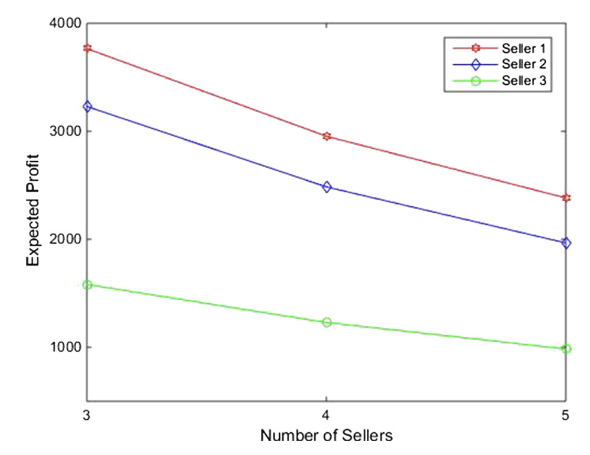
The paper enumerated typical network topologies on this seller-buyer model and calculated the expected profit (calculating equilibrium points) and how number of sellers can affect the profit.
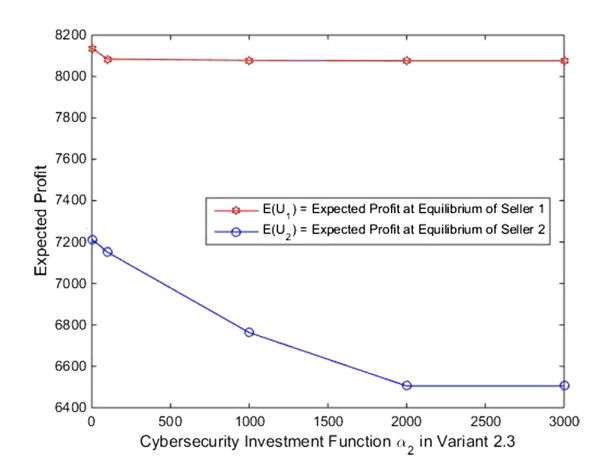
The second figure, for example, could reflect a scenario where Seller 2 has expanded his cyber infrastructure and needs to invest more in appropriate software to protect the network. Seller 2 now has an equilibrium security level that is one quarter of that in Variant 2.3. Interestingly, not only do his expected profits decline but also those of Seller 1 do.
In summary, the computational scheme proposed by this paper has nice features for implementation and results in closed form expressions (both for the product transactions and security levels). This result can be used in security investment analysis to help company make critical decisions.
Reference: A game theory model of cybersecurity investments with information asymmetry https://link.springer.com/article/10.1007/s11066-015-9094-7
One of the interesting concepts that we recently learned in class was game theory and payoff matrices. As we have seen in lecture, an important part of these games is that the players themselves want to maximize their payoff. In the piece, The evolution of cooperation in signed networks under the impact of structural balance, by Xiaochen He and co, they use game theory and payoff matrices to create signed network model that better helps to understand how cooperation will evolve on a graph.
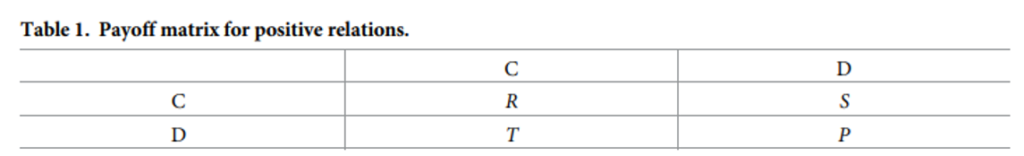
First, the authors describe the PD model. The prisoner’s dilemma model using the following payoff matrix and it essentially breaks up the nodes in the graph into two separate groups: cooperators and defectors (He et al., 2018, p.4).
Payoff matrix for positive edges
In these relations, the cooperators are trying to establish positive relations with other cooperators so that they can both get a payoff of R while defectors cheat cooperators and try to establish positive relations with them to get payoffs T (He et al., 2018, p.5). In doing so, this model provides an interesting abstraction towards what we have normally done with signed graphs in lecture. To my understanding, while we defined the relations of signed networks, the model used in this paper not only defines cooperative intentions in this relations, they also define strategies of how the node makes it relations by defining them as either cooperators or defectors (He et al., 2018, p.4). I thought this was an interesting model because it builds upon some of the ideas we have learned in class by adapting the payoff matrices from game theory and applying it to signed graphs.
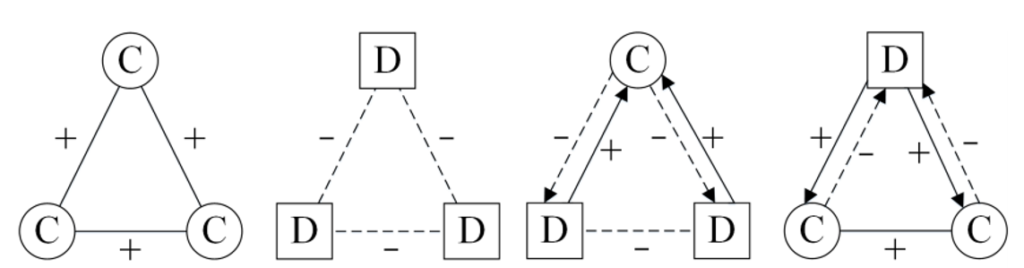
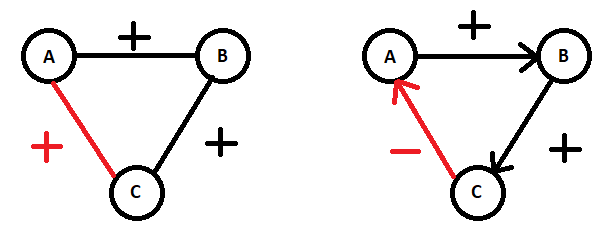
Following this, the authors then apply structural balance onto this model and help describe how this affects what balanced triangles would look like on the graph. It goes as following
Ideal triangles of PD model
While the ideal triangles of the PD model look as such, we can clearly see that some would not fit within the definition of structural balance. By applying structural balance, the authors insist that the only possible balanced triangles would be where we had three cooperators where each had positive relations with one another, and where we had two cooperators with a positive relation whom had negative relations with the defector (He et al., 2018, p.5). This follows what we have learned in class as these triangles have either one or three positive edges.
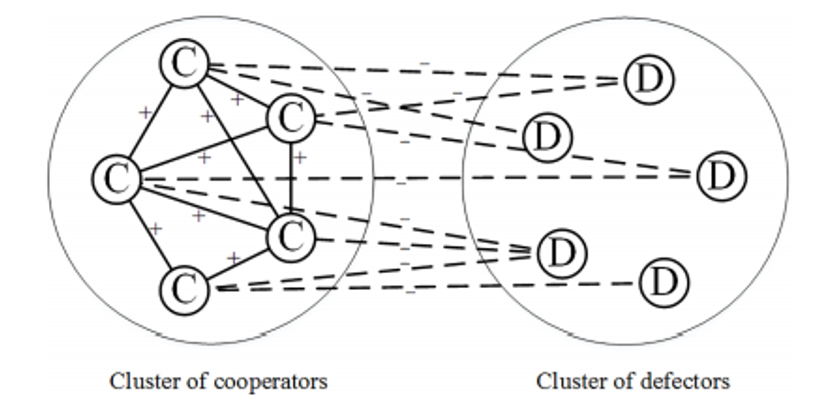
PD model with structural balance
With structural balance, we have a network where we have our cluster of cooperators and their positive edges and then we have another cluster of defectors who share no edges with one another but receive negative edges from nodes within the cooperator cluster (He et al., 2018, p.5).
To test cooperation, the authors used Erdos-Renyi graphs and applied an algorithm to update their edges and behaviors iteratively (He et al., 2018, p.10). They did so under multiple different criteria, each differing in their usage of structural balance. In doing so, they could see how the usage of structural balance affects how the graph evolves over multiple iterations.
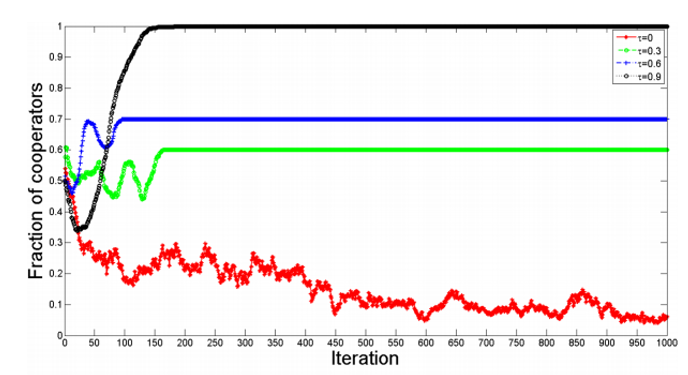
Fraction of Cooperators without structural balance
In the case of not using structural balance, they noticed that as the probability of an update of a node increased (i.e. τ approaches 1), the graph would become entirely composed of cooperators with positive edges (He et al., 2018, p.9-10).
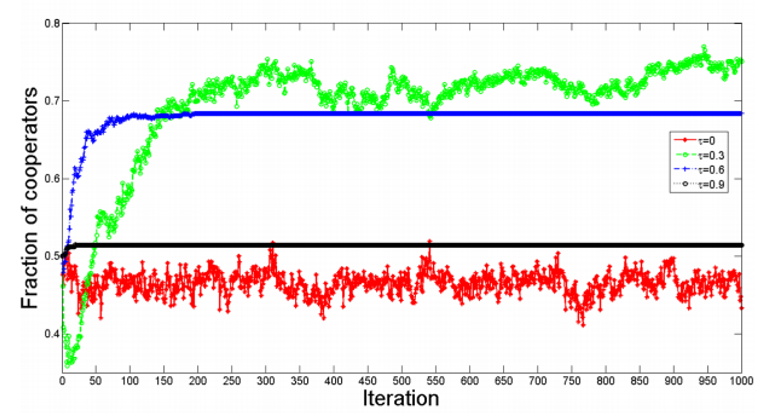
Fraction of Cooperators with structural balance
In contrary, when using structural balance, while the fraction of cooperators increases, there will still always be some defectors (He et al., 2018, p.12). As such, the authors suggest that in structural balance, it is not possible to remove the defectors because of how the balanced triangles work (He et al., 2018, p.12). For instance, it makes sense that all cooperators will have positive edges as they are share the same payoff. In the case of two cooperators with one defector, since the cooperators have negative edges towards the defector, there is no incentive for the defector to become a cooperator since it would be lessening its payoff unless it was able to cause the edges to switch signs (He et al., 2018, p.12). In doing so, we likely will be stuck with the defector and the balanced triangle.
To conclude, the authors reiterate that the implementation of structural balance in their iterative model ends up with their graph containing both cooperators and defectors with the two specific balanced triangles and that cooperation succeeds as the probability of the edges switching signs increases (He et al., 2018, p.14).
I personally found this paper interesting as it uses game theory and signed networks and creates a model that combines both concepts. Furthermore, the model is interesting in evaluating cooperation. We could use this model in different contexts that contain two different groups of individuals, one where they have incentive to cooperate and one where they have incentive to cheat others. An example could be competitive environments like schooling where there are those would cooperate and make clusters and those who would not (i.e not doing work in group projects).
References:
He, X., Du, H., Cai, M., Feldman, M.W. (2018). The evolution of cooperation in signed networks under the impact of structural balance. PLoS ONE 13(10): e0205084. https://doi.org/10.1371/journal.pone.0205084
With Black Friday around the corner, North America will have a very different experience of this retail holiday than the last decade.
Since the inception of malls, shopping in person has been wildly popular amongst consumers, they are able to view their products and try it before purchasing, which are major benefits for making the payment decision. However, competition arose when online giants such as Amazon, eBay and various dedicated websites started to gain traction. This has created the current online shopping culture, buying from the comfort of our home and delivered to our doorsteps.
The circumstances surrounding this year is worse for retail and malls. The ongoing pandemic is likely to last through most of the major holidays for shopping; Black Friday, Cyber Monday and Boxing Day. Many of the retail chains have already been closing down some of their less prominent locations and with social distancing and various lockdown throughout the current event, shopping in person has never been more unpopular. On the other hand, the boom of online shopping is going on strong as it became one of the best ways to cure our retail needs in this global situation. Not all hope is lost, with every turn of events comes an opportunity. At the moment, many of the stores are closing their physical location, this in turn opens up more avenues for bigger chains to leverage.
One of the interesting factors about Game Theory, is that it even appears in choosing the location for retail shops. The reason why similar businesses open next to each other is due to this configuration being the Pure Nash Equilibrium where both parties cannot deviate from the current location to gain anymore benefit.
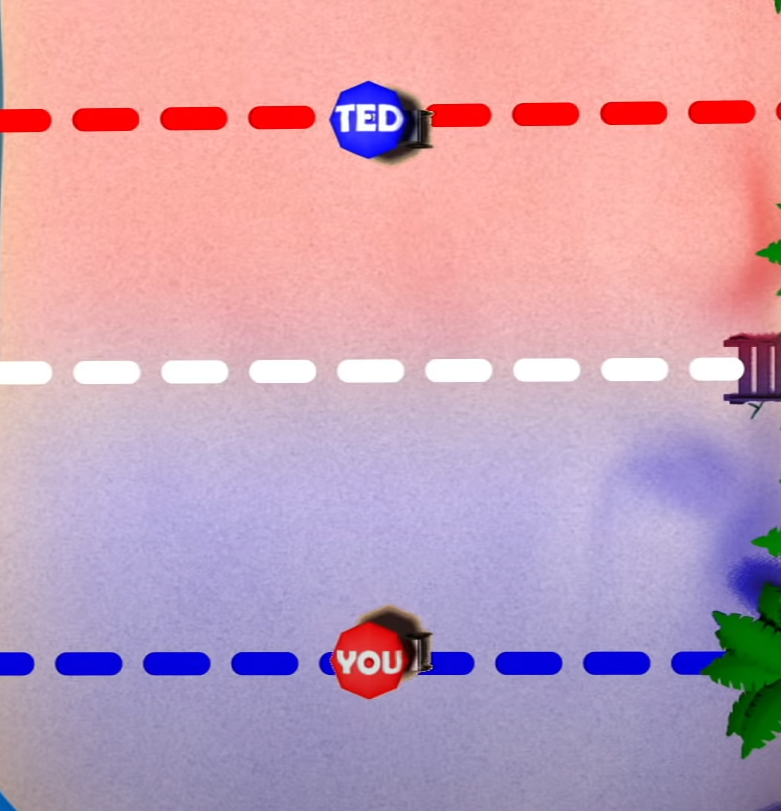
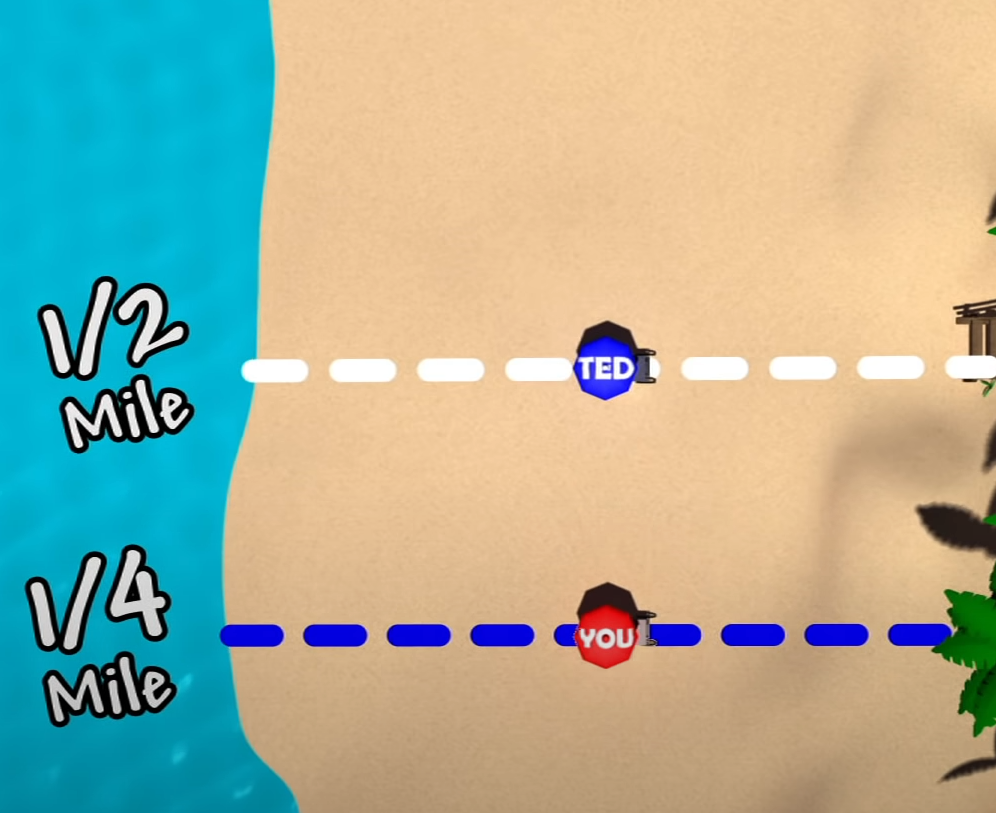
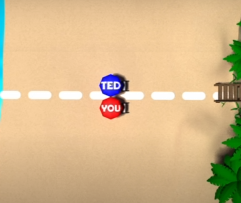
Let us consider the following situations (from TED-ED)1. Two competitors are selling ice cream on the beach. In the first scenario where a line down the middle separates them, and they each occupy their own halves. In this case, both parts would get half of the sales, but there is a better play for one of the stores. Consider figure 2, where Ted moves to the middle, now he gets his original sale and splits the sale between ½ mile and ¼ with you. Both parties would continue to move to the advantageous position until they both settle down in the center where they cannot deviate from that position to gain any benefits.
Figure 1: line down the middle splitFigure 2: Ted occupies the middleFigure 3: both parties reaches Nash equilibrium
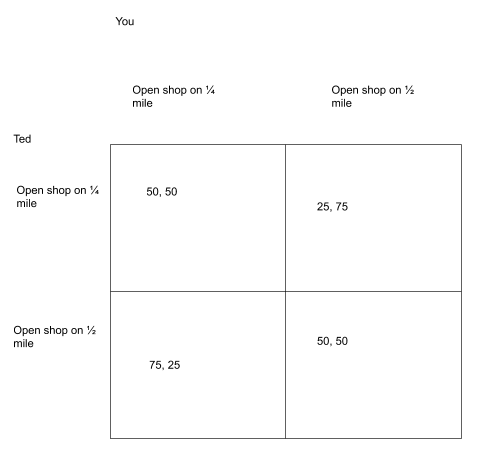
Figure 4: payoff matrix, we can see Pure Nash Equilibrium is opening shop at the ½ mile together.
How this does apply to the current pandemic? With the closing of many stores, the bigger players of retail sector can purchase more storefronts to obtain a bigger payout than their competitors in physical locations. Consider the previous scenario, however, this time Ted has 2 stores instead. In that case, you will always obtain a lower payout than Ted where he can surround your store on either ends and taking over half your sales. Normally, this would not be achievable due to the cost of purchasing storefronts and competitors owning a location nearby. But this pandemic has opened up many retail spaces for taking.
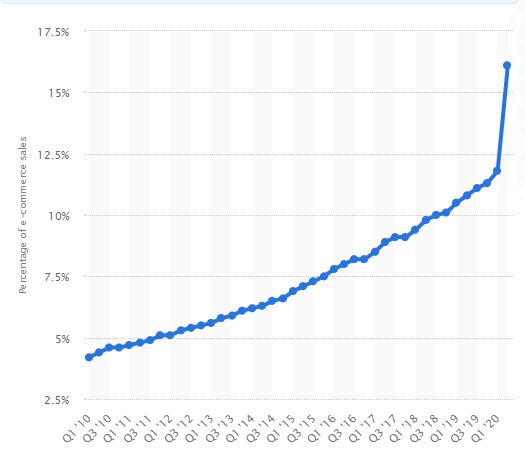
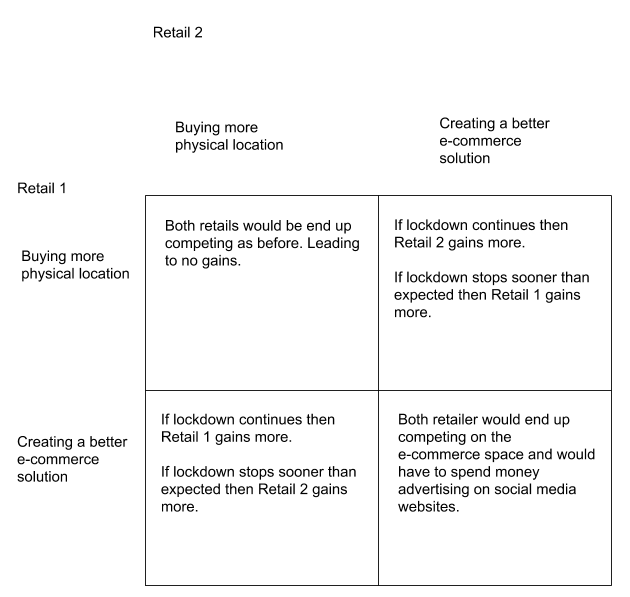
Next, let us consider the e-commerce side of shopping. With the current pandemic, a lot of the purchases are being made online in e-commerce giants like Amazon. With this in mind, would it be more beneficial for current market to purchase more storefronts to attack competitors on the physical locations side, or is the money better spent on establishing their own online store and delivery routes instead? The answer to this question lies within the payoff of each situation and it’s hard to calculate without knowing the specific numbers. Even with the current pandemic, we can see that the percentage of sales rising from e-commerce is still only a fraction of the sales a store can gain from having a physical location. However, we are comparing the gains of purchasing more storefronts vs diversifying and investing the funds into producing an online shopping solution. If we were to construct a payoff matrix, the matrix itself would not have any Pure Nash equilibrium and instead would be mixed strategy. As the best strategy would depend on the expected payout and the company would then split their funds accordingly.
Figure 5: percentage of E-commerce sales of total retail sales (Statista)Figure 6: Example of a payoff matrix for investing into physical location vs online solution.
In conclusion, this Black Friday might be the first mark towards a very different shopping experience in the next decade. If the sales figure points to online shopping producing a better net sale, then it is possible more retail giants would not hesitate to close down their less popular locations and invest into a better e-commerce. However, if the sales figure points towards the traditional method being superior, then we might see the bigger players of retail popping up more stores over the next few years. Although, a major factor to consider, and the creator of this situation, is how long will lockdown and the global pandemic last. This factor will also be a major player in deciding the retail landscape for the next decade.
On November 20th, Premier Ford has announced that he would bring “tough” new measures to places in Ontario. As many measures like social distancing are only effective if everyone complies, the topic of why someone would or would not comply with these measures became interesting to me. We have seen numerous protests against the lockdowns as well as other measures locally and in other places in the world.
In the article by Brune and Wilson, the ‘Public Goods Game’ (PGG) was used to describe the COVID-19 measures situation. In a PGG, all players have a common goal which in this case is to return back to a life that is COVID free. But, it is possible to not contribute towards this goal and still enjoy the public good (the common goal). This goal is non excluding and should we reach it, those who did and did not contribute with enjoy the payoff equally.
Brune and Wilson break down the payoff as done in our class material for the social distancing measures that have been implemented. Brune and Wilson identify that the obvious benefit would be that it slows down the spread of COVID-19. However, the downside of this measure is the added stress social distancing can cause which also negatively impacts our health. In this PGG, Brune and Wilson identify that there is a minority of people who defect and choose to ignore these measures without regard for their own health and others. Brune and Wilson suggest that in order to decrease this number of people who choose to defect, the payoff for choosing this response should decrease.
PGG says that cooperation decreases over time and I think that is an important aspect of PGG that makes it relatable the current COVID-19 situation. After almost a year, the amount of cooperation may go down and it may make controlling this virus more difficult than the first wave.
Overall, I think Brune and Wilson were successful in identifying payoffs of social distancing however, I think it would have been more helpful if a payoff matrix was made like the ones we have seen in our course material with values assigned to the benefits and punishments in this ‘game’. I think having this matrix will help show why certain players in this game would choose a certain response and can even help governments decide how to increase the chances of players choosing to obey the restrictions. This can be done by decreasing the payoff as mentioned earlier by Brune and Wilson or through other means. Governments can try to introduce pure strategy nash equilibriums so that players would always choose to obey the restrictions.
Due to the pandemic, I am lacking the fix of my yearly fantasy hockey league where I can ponder over the underperformance of my favorite players as they disappoint me once more. For the uniformed, fantasy sports is where a group of individuals select players from any team in a specific sport league and compete against each other in a battle of meaningless statistics. IT IS SO MUCH FUN. But much like my last post, there is one thing more enjoyable than experiencing it, and that is winning it. From a variety of articles, multiple aspects of social decision making pop up in a way to help better your own drafting abilities and understand your opponents behavior.
Let’s start from the beginning, the draft. This is the start of any fantasy league where the participants select there players in some round based fashion, usually snake draft where if you picked last in one round, you pick first in the next round. This all being said, there are two things to keep an eye on when drafting players: opponents’ needs and pre-determined rankings.
The first concept is covered in 4for4 article understanding the basic concept in game theory revolving around a best strategy as a response to another. Filling a single position early will result in others competing for the other top players there or wait for late round value. Additionally, since fantasy is structured as a Zero Sum Game, it may be beneficial to hoard players of a certain position and high value to essentially give your opponents minus points.
The standard format for a Yahoo Fantasy Hockey Draft (I miss this)
The second concept discussed in the FantasyPros article is the idea that Herd Behavior is all over draft day. The presence of “expert” rankings and average draft position skew players into picking players earlier than expected. As discussed in lecture, herd behavior stems from earlier drafts, but the main problem in fantasy is skewed data as many people forget to draft live and let a computer just draft based on rankings or “experts” are not taking into account other factors such as team roster changes or age. The article discusses the idea that picking players out of the given draft order can lead to much better results as not only does it avoid competition for a position, but also based on your own knowledge, have huge upside. Personal example, in 2017-18, I selected an unknown forward to the league named Brayden Point with my third last pick; he would end up top 50 in scoring that year.
Post draft, it is all about roster management. Starting specific hot players or players up against weak teams, as suggested in the FSPortal article, is just a simple 2×2 Payoff Matrix away to determine which of these provides the highest upside for the team. This can also just be applied to picking up and dropping players for their performance.
Trading Notifications for Fantasy Football
Last thing to talk about is trades. Much like real managers, sometimes you need to improve some part of your team to optimize the chance of winning. Teams may lack scoring or have inadequate defensive stats or poor goalkeeping. RideorDynasty article on the idea of trades being Cooperative Games is spot on as no one wants to come out behind in a trade. The idea is that the two teams participating are trying to achieve a Nash Equilibrium, where the payoff is a mish-mash of stat increases and decreases. Understanding this allows one manager or the other to adjust the trade until they reach said equilibrium.
Overall, the idea of fantasy is one giant zero sum game, but there exists many small aspects that spread all across the social decision making concepts discussed in class. Whether from understanding rational decisions to knowing when to deviate from them is all important in maximizing your end of season standing. And unlike real managers, all you lose for screwing up is a bit of dignity.
The popular card game of poker has been studied for many years for its various applications of mathematical principles. The complexity of the game along with the addition of several opponents making predicting the winner difficult to approach. The paper written by Jingyu Li focuses on a two-player poker game in which he analyzes the strategies for each player. In order for a player to time, they need either a made hand or a draw hand. In a made hand, the player does not have to wait in order for more cards to be relived to have a winnable hand. A draw hand refers to a hand that can potentially be a winner depending on the drawn cards that follow.
In a real poker game, neither of the players are aware of their opponents’ hands so they must act on implied odds. This allows them to make more money as more cards are revealed later in the game. Every time a player raises the pot or check when the opponent matches. If both players are able to predict each other’s games, they can use their expected value to determine if they should further bet on the given hand. However, in a real poker game, players can bluff on their hands to raise the stakes of the game without having a high probability of winning. This makes it hard for a player to derive a generalized strategy.
In a game like poker, having a fixed strategy leads to diminishing returns over time as the opponent can exploit the strategy by playing predicting your moves beforehand. Therefore, the strategy should be created that focuses on a range of cards upon which you would bet on while folding on anything outside of that range. For example, even if you have a bad hand inside your range, you should bluff on your cards rather than folding. Furthermore, there exists a concept of an indifference in which a player gets the same amount of expected payout regardless of the strategy chosen. This indifference is used with an indifference threshold which allows a player to determine when their strategy is indifferent.
Figure 1: Alice’s payouts
Consider the payoff matrix shown in figure 1. In this case, Alice should always bet when she has a winning hand, regardless of what Bob might have. In this scenario, P refers to the money in the pot that the player wins at the end of the game. When Alice has a dead hand, she has a chance of winning the pot only if Bob chooses to fold. Otherwise, she loses the $1 that she bets on her dead hand that is going to lose. In this scenario, Alice should deploy a bluffing strategy that would make Bob indifferent by picking any of his call or fold options yield the same amount of money. Bob’s strategy on the other hand should be to make Alice’s strategies of Betting or Checking on a dead hand indifferent. Which would make her choose the one that benefits Bob.
Overall, this paper captivates a good strategy that players employ when playing the unpredictable game of poker. They can choose a flexible range to stay within when betting in order avoid being exploited over time by the opponent. However, even such strategies must be mixed with discrepancies in order to avoid being predicted by the opponent. This paper provides a good real-life application of game theory from the material we discussed in class. Many of the great poker players have made their careers in poker because of their ability to exploit their opponents and devise a changing game plan that allows them to win big money.
As seen in class, the Page Rank algorithm is an important algorithm for helping us organize the web. In fact, what might sound as one of the most mundane uses for any algorithm, the web’s equivalent of perhaps a librarian, figuring out relevant books from irrelevant and deciding which books go where, is quite the understatement. It is this very algorithm that helped form the roots of a very small, tiny company that you may have not heard of – Google. Yes, a household name and the company that engineers around the world dream of working at. The life of this company started from a simple question. “How can we structure the web?”. The answer to which was Page Rank.
Ask anyone, regardless of all the services that Google provides it is no doubt that the cornerstone of the company is still its search engine. Its bread and butter is providing you everything you might need from the web based on only a few words or phrases. It will always do its best to provide the most relevant, and reputable web pages that will almost always leave you satisfied. In fact, it is quite rare any of us even have to go to the second page of search results. Is this magic? Larry Page and Sergey Brin, the founders of Google, would beg to differ. Designed by both in 1996, this algorithm used the very structure of the internet to assign a Page Rank value to each page in the graph structure of the web. It was this that Google search used to figure out which order the search results should appear in. However, Google’s search takes in up to 200 other factors as well to determine these rankings, which makes it clear why no other company has ever had as much success in the search engine game. Regardless of that, it is still no doubt that Page Rank is still the most famous and widely known algorithm out of all the ones that are used.
It was in the year 2000 that Google’s toolbar enabled users to not only search the web but to also have a look at the Page Rank of individual pages. However, this visibility often created competition and fraudulent uses of the algorithm with link selling and link farms. This was also one of the very interesting problems that we had a look at in our homework assignment where we saw how these metrics could be easily inflated with the use of very specific graph structures, and often even interlinking two farms that aided in further boosting these metrics. Here we see that the knowledge of the structure of the web as well as how the rankings are done not only make it clear how searching the web is conducted but also open the door to evildoers who seek to exploit it.
Further down the timeline, in 2003, Google’s attempts to fight back against link selling led it to take specific actions against a network known as SearchKing. The site itself and many of the pages on this network had their ranks penalized. SearchKing sued Google following this, however, Google came out victorious in the legal battle and pushed back against all kinds of link selling as well as other fraudulent means of trying to play the algorithm. This proved to not be effective, however, as no matter how much Google fought back, other link farms would open up. Google used a modification to the algorithm that made deductions to the ranks of detected and suspected link farms that inflated the rankings and manipulated search results. Thus, the rankings for these would be deflated and would not appear in the search results.
Starting in 2008, Google realized that although Page Rank on its own was a successful and effective way of organizing the web, these bad players made it difficult to keep search results up to the high quality that people expected from them. Thus, Google went dark with its Page Rank algorithm. This simple and elegant solution to the internet itself was not quite enough to be the trillion-dollar idea it is today. Google needed to modify it and grow it into something that could not easily be tampered with. Chrome was released soon after and all the toolbars that had lived on people’s internet browsers for so many years slowly died and disappeared after their long lives of service. As long as people knew the algorithm, it was open to manipulation.
So, what happened to Page Rank and is it still in use? Google’s new algorithm, as mentioned earlier, uses many different factors now to determine the ranks of pages across the web. And still among them sits this old but true algorithm. No matter how Google may change, until the next trillion dollar algorithm is found that not only does and improves upon what Page Rank already does, and is impervious to manipulation, this is an algorithm that is here to stay. And we can all agree that we owe it for its work in making the internet a more accessible place for us all.
24 years now, and Page Rank is still one of the most widely used algorithms. This only goes to show the genius behind it. In fact, the algorithm is not only used for web searches. Its uses could also be found in other non-web applications all around us, ranging from sports to find the top athletes in networks of players in a team, literature to quantitatively find original writings, neuroscience, toxic waste management, and even debugging code! Clearly this algorithm hosts many rich features that speak just as much about the algorithm itself as well as the minds that came up with it. The power of any network is only as great as the meaning that is able to be extracted from it. And it is no doubt that Larry and Sergey have unlocked one of the most remarkable ways of looking at the world of networks, cementing themselves through their company as masters of information networks.
Link analysis is a method of organizing the given data, specifically in the form of nodes and edges, and deriving patterns to attain valuable insights. Suna (2019) answers whether the network analysis can predict success in the box office.
The crucial aspect of this analysis revolves around the idea of Degree Centrality, which could be represented mathematically as the following:
Note that we normalize the expression according to the number of nodes in the graph. Graphically, the degree centrality of a given node corresponds to the number of out-links it has as a ratio with the remaining nodes in the network.
To start analyzing the success of the box office of movies, we construct a network like the following:
From a list of movies with the casting members ordered by release date
Nodes: Movie Actors
Edges: Co-starred
Suna (2019) introduces the variable of significance for the stars in a movie by simply extracting the three main characters from them. This leads to a network consisting of the most impactful actors in movies with links to other impactful actors that have co-starred in movies. Furthermore, the degree of centrality for each of the main characters are calculated using the formula mentioned previously.
Extracting a well-known actor from the network will result in a densely connected component that resembles the following image.
Nicolas Cage’s Degree Centrality
From the above component, we see that the degree of centrality of a given actor is directly proportional to the popularity and the significance the actor brings to their movies. Nicolas Cage, for instance, seems to have a high degree of centrality. This brings us to the question of whether this degree of centrality is correlated to the box office success of an arbitrary move. After analyzing the degree of centralities and the revenues of movies using the Spearman Correlation Coefficient, Suna (2019) found that the degree of centrality of a given actor is indeed statistically related to the revenue of the movie they have acted in. Specifically, the more significant the actor was in a movie, their degree of centrality seems to have a higher statistical correlation with the revenue of the movie.
This form of link analysis is similar to that of the Hubs and Authorities algorithm (HITS) that is used as a voting mechanism for web pages. The HITS algorithm iteratively calculates the centrality of a given web page, which serves as a quantitative value for the importance of a web page. Therefore, we have seen that analyzing a movie star network using a form of link analysis could help with predicting whether or not a movie was successful in the box office, which highlights the importance of the centrality of nodes in a network
References Suna, Ahmet (2019). Can Network Analysis Work for Predicting Success of Box Revenue. Retrieved November 19, 2020, from https://towardsdatascience.com/can-network-analysis-work-for-predicting-success-of-box-office-revenue-c8370c8427f9
Two perfectly rational gingerbread men, Gingerb and Read, are taking a stroll through the forest when a hungry wolf jumps out at them a la Swiper from Dora the Explorer style. The gingerbread men recognize this scenario and chants an ancient spell to protect themselves: “Swiper, no swiping!”. The wolf simply laughs. He could easily eat both of them but is slightly amused at their futile attempt. He proposes a game:
“You have the option to sacrifice or spare the other cookie. If you both choose to spare the other, I’ll eat just one of your limbs. If one chooses to spare and the other chooses to sacrifice, I’ll eat the sparer while the sacrifice is free to leave. If you both choose to sacrifice, I’ll eat 3 limbs each.”
Sound familiar? This is classic example of the Prisoner’s Dilemma. The payoffs are the amount of limbs they’ll have remaining:
There exists a Nash equilibrium where both gingerbread will always want to choose the sacrifice strategy, so both perfectly rational gingerbread will hobble away having lost 3 limbs and a friendship. Now here’s where it differs.
A secret observer has been watching this situation unfold the entire time. Like a person who chooses to film on their phone rather than help. This bystander uses their magic and teleports next to the gingerbread, loudly shouting “You fools! Why have you chosen such a rational but terrible decision?!”
Gingerb and Read: “Please powerful wizard! Help us get our limbs back?”
Wizard: “I will grow all your limbs back, but at each sunrise I will tell the wolf to come back and history will repeat itself for the rest of your lives!”
Now this has turned into the Infinite Prisoner’s Dilemma. What a fun twist. The gingerbread must now consider what happens in the future in order to make their decision in the present. Let’s see what the possibilities are for these gingerbread now.
If one of the gingerbread decides to sacrifice while the other chooses to spare, the other petty gingerbread will retaliate by choosing to sacrifice for the rest of their lives.
Would knowing this be enough to force these two to choose the spare strategy? We can figure this out by considering a factor δ where 0 <= δ <1, which represents the amount they care about their future limbs. In other words, if δ = 1/2, then on the first day of this sordid situation, they will care about their limbs just as much as they would normally. On the second day, they’ll care ½ as much. On the third, ¼ and on the fourth, 1/8. If δ is 0, this means they don’t care about their future at all which brings us back to the original Prisoner’s Dilemma where both will choose to sacrifice permanently. If δ approaches 1, this means they’ll always spare each other.
Why do they care about their limbs less and less? This dilemma will last forever. While their initial reaction may be to protect their limbs, gradually they’ll become more apathetic as they come to terms with this calamitous chronicle. So, what is the minimum δ required for them to both spare each other forever?
To answer this, we can write the infinite series that represents each strategy, setting them equal to each other and then solving for δ.
If they both choose to spare:
If they both choose to sacrifice:
We end up with δ = 1/3.
This means that if they care about the next day at least 1/3 as much as today, the best strategy is to choose to spare each other forever.
This situation can be compared to real life. The decisions we make today affect the decisions that others will make tomorrow. While some easy and rewarding decisions may seem a lot better, those around you will remember what you have done and may cause you more trouble than you can handle in the future.
With social media being a big force in modern virtual and non-virtual relationships, there are some interesting analyses done on the signed networks that exist within the platforms. In the article titled Signed Networks in Social Media, the three researchers Jure Leskovec, Daniel Huttenlocher, and Jon Kleinberg, take a look at the network representations of 3 online platforms Epinions, Slashdot, and Wikipedia. Epinions, an ecommerce platform, Slashdot, an online social news website, and Wikipedia, the online encyclopedia all incorporate aspects of a positive/negative relationship for their users.
On Epinions, users can give ratings not only to the items sold on the marketplace, but also to other users on the site as well. On Slashdot, users can label other users as ‘friends’ or ‘foes’. Wikipedia periodically has volunteer candidates considered for a promotion into an admin role on the platform, and the community casts public votes for whether they are for or against this promotion.
The table below shows the data for the signed relations within these networks. These figures show that for weak structural balanced networks, triangles with two positive edges are massively underrepresented. Triangles with three positive edges are overrepresented when compared to the other types of triangles.
The data from these 3 platforms give further developments for signed networks. For triangles within signed networks, we label balanced triangles as triangles with an odd number of positive edges. Balanced signed network analysis is usually applied to undirected networks. This is where the ideas of “the friend of a friend is a friend”, and “the friend of my enemy is my enemy” came from. An idea that is explored in this paper is the theory of status, which has applications in directed networks. Status in signed networks indicate that the creator of positive links view the recipient of the relationship as having higher status, and the creator of negative links view the recipient of the relationship as having lower status. A good way to distinguish between these two theories is their proposed situation: A links positively to B, B links positively to C, according to the balance theory, A should link positive to C as well as C is a friend of a friend. However, in the status theory, since C > B > A, C should view A as having lower status in the hierarchy.
Since social media and many of these online platforms tend to be used for personal satisfaction, such as finding interests or a community to belong to, it makes sense that positive triangles are overrepresented. People tend to dislike being involved with online conflict, as many internet celebrities nowadays are constantly being very cautious in order to have a good public image. It is also relevant to average users as well, people want to maintain good relations and a good public image to their fellow friends on these platforms. On websites like Linkedin, keeping good connections and avoiding creating bad ones are important, as having more of a positive profile opens up many more job opportunities.
Social media is an entity that has now been decades old, and is built on the relationships of its users. These analyses done on the networks between the relationships on these platforms can teach us the trends between how users use their service, and additional data collected can even further improve the user experiences for everyone around the world.
In self driving cars and autonomous vehicles, one of the most important features to implement to make a truly self driving autonomous car in a environment where there are a mix of both self driving and manually driven cars is lane changing. In a lane change, the autonomous vehicle has to predict the actions of the vehicles in the incoming lane and adjust speed and decide on when to commit to the merge. This decision is one that needs to be made before the merge lane ends and is subject to a lot of adjustments and on the fly decisions. An aggressive approach can be potentially dangerous and a cautious approach might impede traffic.
This decision and control can be modeled as a game, in which the payoff is a compilation of several factors, the safety, which is calculated by the rate of change in the safety factor between the time the decision is calculated and the moment, and the safety factor is calculated by the distance between cars as defined by this function:
The payoff also factors in the distance between the two vehicles, this payoff also takes into account the time it takes for the vehicle to merge into the destination lane.
The total payoff is a linear combination of the two above payoffs.
And the payout function can be estimated given the parameters fed to it by the car:
And the game can be solved by the equation:
where Ut denotes the total payoff.
The article then breaks down the lane merging action into a game between two cars. And the payoff of the opposing car can be estimated by the aggressiveness estimate, can let the merging car predict to a extent the behavior car 2 will take.
Citations:
Yu, H., Tseng, H. E., & Langari, R. (2018). A human-like game theory-based controller for automatic lane changing. Transportation Research Part C: Emerging Technologies, 88(Complete), 140–158. https://doi.org/10.1016/j.trc.2018.01.016
This article (The coupling relationship between standard development and technology advancement: A game theoretical perspective) presents analyses of the optimization of benefits when comparing trade-offs between technological advancement and standard development. They describe that these two development processes have interests that sometimes conflict based on various factors including culture, economics, efficiency, and corporate competition. Often, the standards can be abused to outshine startup innovation and prevent new technologies from emerging. However, standard development also provides compatibility across technologies, reducing fragmentation. Their aim was to discover, by using game theory, how these processes can be handled to minimize problems and maximize utility.
Figure 1. Relationship between technical standards and technological development.
As we see in Figure 1., they outline the relationship between technical standardization and technological development by showing factors that influence the processes; these either promote or suppress technological advancement. To analyze the relationship, they construct a game matrix as seen in Table 1. where technological advancement chooses a strategy between the columns and standard development chooses between the rows. The usual assumptions that both players simultaneously act and have knowledge of the factors of influence for one another’s strategies hold. As well, the payoff is ordered with standard development’s payoff first and technological advancement’s payoff second. In the game matrix, Behind indicates that the associated player is in a prior state of development compared to the other player and Ahead, the opposite. When both are Behind or Ahead, they are seen to be generally behind/ahead of the industry. The variables in the table are all positive values and reveal two outcomes of possible Nash Equilibria depending on their relative values.
Table 1. Generic game matrix.
The first outcome is when A > E and D > F; this outcome has two Nash Equilibria: (1) technology advancement is behind standard development and (2) technology advancement is ahead of standard development. In this case, there is a competitive conflict between the two players. However, they mention that competition eventually reaches optimization.
The second outcome is when A < E and D < F; this outcome has one Nash Equilibrium: (1) technology advancement and standard development are at advanced levels. In this case, the two players cooperate and is the optimal stage that would be desired.
Notice, however, that when an entity is in the situation of being Behind in both processes, the only possible route to advance is to take one of the competitive paths rather than the cooperative path; this is often the case for developing societies that do not have the structural maturity to accomplish both immediately.
In the first case they define the technology jungle: where technology advancement is ahead of standard development and any new technology has the possibility of becoming the standard. Table 2. shows a possible matrix of such a situation. Clearly since 8 > 7 and 5 > 4, a Nash Equilibrium resides with the technology advancement ahead of the standard development.
Similarly, they define cultivation: where standard development is ahead of technology advancement; in our example we see the Nash Equilibrium where 6 > 1 and 10 > 9 (Table 2.). This is the case where policies are made before creation of technology.
Neither the technology jungle nor cultivation scenarios are favourable as described earlier where abuse of standards can lead to monopolization and lack of standards leads to fragmentation and wasted resources.
Table 2. Matrix for a non-cooperative game.
This last case is what would be possible in, as they describe as, an ideal world: where both technology advancement and standard development are ahead. As we can see in Table 3., we have 9 > 2 and 8 > 4 giving us the Nash Equilibrium with both players Ahead. This indicates that any new technology can be compared against standardization and development of standards leads to deployment of technology soon after. They note that this scenario leads to the greatest success of the party employing it. This, however, is difficult to achieve due to various factors especially for newer economies.
Table 3. Matrix for a cooperative game.
It is clear that these cases have huge implications on how societies should operate their development of policies and technology together to optimize their growth. This also presents how powerful game theory can be in helping to distinguish particular scenarios between conflicting processes. This can be helpful for policy makers in making decisions on standard development of technology to promote the best outcome possible for their society.
Reference
Jiang, H., Zhao, S., Yuan, Y., Zhang, L., Duan, L., & Zhang, W. (2018). The coupling relationship between standard development and technology advancement: A game theoretical perspective. Technological Forecasting and Social Change, 135, 169-177. doi:https://doi.org/10.1016/j.techfore.2017.11.018
Ashton made a great introduction to information cascades and their relevance in networks with competing ideas. However, another side to information cascades is how sensitive they are to introduced changes and relevance on prior information. Information cascades tend to occur when the result or effectiveness of a certain idea/product is more closely associated with a private value and popularity than on well known information. A great example of such a situation is evaluating the quality of technology: more people adopting it benefits the technology’s ratings than the actual rating of the technology relative to its competitors. Although a device/program may not be the best, if it’s good enough and well rated, it attracts more customers and thus, more ratings. Rinse and repeat.
A paper I read (see below for references), illustrates both presence and fragility of incorrect fads well. To put things in a simplified model, assume that a group of people need to draw from a bag and pull a red or blue marble. The bag can either have 2 red and 1 blue or 2 blue and 1 red (50% chance each This is done privately and the marble is then replaced. They then must publicly declare a colour of marble that they drew, but there’s a catch: if they declare the colour of marble that is the same as the majority of participants, they get a prize. Each participant does this one after the other and future participants see the previous participants’ declarations.
The first person who draws a marble simply declares the marble they draw. However the second and third individuals act differently. If there is a majority out of colours drawn, they will declare that colour, if not, they will default to declaring their own colour. From fourth person onwards, they are incentivized to declare the colour currently in the majority regardless of what colour they draw (and there will always be a strict majority if all participants follow this rational logic). This effectively forces an information cascade.
This means however, that participants also have a chance of creating an incorrect information cascade. This is the issue in the simplified model: it’s where declaring the choice of colour (or technology) you use to be strongly coupled with the actual quality of that choice. Thus, sometimes, whichever technology fad is first (and of sufficient quality) will prevail. This is in the case for Microsoft products, the qwerty key board and many household-named products.
Fragility of Incorrect Fads
Fortunately technology is ever improving, and if a product ever becomes of poor enough quality, users of that technology will deviate. This also similarly applies if you people openly declare that they are opposed to the technology they have used, but only do so for the majority’s sake. A key to breaking fads is the transparency in the rating and evaluation of products. In fact, this applies in the simple model with marbles. If each participant also publicly disclosed which marble they drew, they would all be incentivized to choose the more common marble regardless of other declarations.
In closing, the best quality and choice of technology (and any comparative decision) hinges heavily on the transparency and reliability of ratings of either choices. Unfortunately, marketing, business contracts and certain standardizations make this particularly difficult. This means that you’ll need to depend heavily on your private evaluation of a product and your intuition of public information.
During the covid-19 pandemic, many of us stay home for self quarantine. Among many entertainment choices, a classic mafia style online game called Among Us has topped the charts for the current most played game in 2020. The mafia style game follows the premise of crewmates who are trying to repair the spaceship while imposters pretending to be crewmates slowly eliminate the crewmates before the ship is ready to make their escape. In this game, there exists dominant strategies and payoff matrices for the decisions and actions of crewmates and imposters.
First off, we can examine the utility functions of crewmates who want to perform as many repair tasks around the ship while staying alive. One can argue that different players will value staying alive or speeding through tasks to be more important on an individual basis. For this a common choice crewmates handle are to either stay together in a group, or run off alone to your own tasks. Next we evaluate the perspective of the imposters. Imposters want to eliminate crewmates without being noticed, so crewmates sticking together is bad for them, while crewmates running off alone makes for an easy job. As such, we can relate to game theory and arrive at a payoff matrix that may resemble something like this:
Payoff matrix between crewmates and imposter
One may find that sticking together is the dominant strategy, yet why is this game not always won by crewmate who possess a dominant strategy against the imposters that do not? The reason may be very well an incentive to cheat among the crewmates. The reasoning being: if others are sticking together, then me running off would let me do repairs faster and not be at risk of getting eliminated by an imposter within the group. Thus another matrix is between crewmates may resemble as follows:
Payoff matrix between large groups of players and a single player
Fortunately for the imposters, they get a chance at always catching someone running off solo because the incentive to cheat a huge cluster brings the Nash equilibrium to scatter large groups. This is in fact the normal behavior of average games where players sometimes only forms small partnerships and travel together as a compromise to both extremes (neither group nor solo). This risks whether or not we trust the partnership on predetermined roles. They can either be an imposter marinating a crewmate for a solid alibi, or they can be crewmates looking for protection:
Payoff matrix for trusting in a partnership without knowing if they’re crewmate or not
In this event, the column chosen is pre-determined, but we won’t know for sure until it’s too late, making intuition a large portion of the decision making process. Trusting someone who happens to be a crewmate is mutually beneficial, while trusting an imposter could get you eliminated, or even becoming a “third imposter”, someone who spreads misinformation in favor of imposters. This concludes the main decision making aspect of the game where dominant strategies conflict with an incentive to cheat. Do you feel its better to stick together, or would you rather trust nobody?
When considering how individuals are influenced to participate in a protest the expected social theory is that a person is more likely to participate if they are exposed to other socially close individuals who are also likely to participate in the protest. This simple social theory of protest may seem rather obvious and although it is vital to understanding protests there is surprisingly little literature that support this idea definitively. The problem lies in the fact that it is difficult to collect meaningful data that would have traditionally involved surveying protestors after a protest about their behavior and decision to participate. However, a team of researchers were able to solve the data issue by using the network structure of Twitter users and show with clear empirical data that an individual is more likely to participate in a protest if they are more deeply connected to people who are also interested in protesting.
The researchers collected Twitter network and geolocation data on users who showed interest in the Charlie Hebdo protests in Paris by tweeting about it and were either at the protest or located near enough to the protest to be able to attend but did not. The first group of users included 764 users that sent at least one tweet related to Charlie Hebdo and were geolocated to be at the protest. The second group which was a baseline comparison also consisted of 764 users who tweeted about Charlie Hebdo but were geolocated away from the protest but close enough to attend. For each group of 764 users, protestors and non-protestors, the researchers looked at their full Twitter network and for each user collected the list of people they each followed (called “ties” ) and the list of people followed by their “ties” (called “ties of ties”). Using this data, the researchers constructed two graphs, gP and gC, that resembled the network structures of the protestor group and comparison group respectively with all their first and second follow connections.
Similar to what we have done in CSCC46, the researchers then compared the two graphs to identify the characteristics of the protestor graph to see what features are unique to the protestors when compared to the non-protestor comparison graph. The researchers hypothesized that in gP the proportion of each protestors “ties” that are to other protestors will be greater than the proportion of each non-protestor’s “ties” to other non-protestors in gC. Similarly, the researchers hypothesized higher proportions of protestor “ties of ties” to be to other protestors compared to the proportion of non-protestor “ties of ties” to other non-protestors.
The results showed that there is a considerably higher proportion of “ties” and “ties of ties” between protestors then compared to non-protestors. This suggests that an individual’s choice to participate in a protest is dependent on the choices to participate of close connections.
The final hypothesis made by the researchers is that triadic ties are stronger than non-triadic ties and therefore should on average be more frequent between protestors than between non-protestors.
This shows the proportion of protestors’ triangles that also contain at least one other protestor (black) and the proportion of non-protestors’ triangles the contain at least one non-protestor (dashed blue). As expected, the data reveals that the protestor group is significantly more connected with stronger ties than the non-protestor group. The use of Twitter’s network data, its transformation into two graphs, and the comparative analysis done on those graphs allowed the researchers to make strong data driven claims about the social theory of protest. I found this to be a great example of what a powerful analytical tool graph theory can be when dealing with inherently network-like structures.
References:
Larson, J.M., Nagler, J., Ronen, J. and Tucker, J.A. (2019), Social Networks and Protest Participation: Evidence from 130 Million Twitter Users. American Journal of Political Science, 63: 690-705. https://doi.org/10.1111/ajps.12436
In a recent lecture, we were introduced to the topic of game theory and a specific type of game: “The Prisoner’s Dilemma”. In this game, the strategies that the rational players will play is not the strategy that gives the greatest payoff for both players. The article “Game Theory Explains the Pandemic”, the author Malini Sharma likens the choice to social distance during the pandemic to the Prisoner’s Dilemma.
While social distancing should be practiced with all members in a community, to demonstrate how social distancing can be a Prisoner’s Dilemma game, she sets up a two-player game and each player has two strategies: strategy “C”, which is the choice for the player to maintain social distancing and strategy “D”, which is the choice for the player to not social distance, i.e. go outside of their home. The payoff matrix in the article looks like this:
We can see that this is very similar to the payoff matrix of the Prisoner’s Dilemma as shown in class, and that the best strategy for the two players would be (C, C) with payoff (5, 5). However we can see that both players the strategy they will choose is “D”, as that is the dominant strategy for both players regardless of what the other plays. This means it is “best” for both players to not socially distance which is strategy (D, D) with payoff (1, 1). The author explains why this could possibly happen. If player A stays inside and socially distances but player B goes out, the payoff for the person who goes out is 8 and the one that doesn’t gets 0 payoff, she states that “player A will get a small benefit (8, 0) but at the cost to others in the society”. Although she doesn’t describe exactly what the payoffs are, it makes sense. The person who goes out gets to go to work and make money, or go out and enjoy themselves (which is the payoff). Meanwhile the person who doesn’t go out doesn’t really get the benefit of social distancing because of the other player breaking the rules and they do not get to go out, possibly meaning they are unable to work, or maybe their mental state is not as good due to the isolation, hence the lower payoff of 0. This means if both players choose strategy D, they get a payoff of being able to go out, but it is severely decreased as the risk of infection gets higher.
Overall, game theory could possibly explain the current state of Ontario’s COVID-19 situation. From an article from the CBC many of the people who contracted COVID are younger people and they speculate that the reasons why they break social distancing are:
That they do not take the pandemic as seriously
They need to go to work
Rewording this in a game theory way, we can say that for the first reason, the decrease in payoff to not social distance is not enough to deter people. The second reason would be that going to work and risking COVID-19, gives a greater payoff than staying home. Finally, the question now is how could Ontario increase the numbers of younger people social distancing. With the game theory model above they have two options:
Decrease payoff of breaking social distancing rules (e.g. fines)
Or increase payoff of staying home and following social distancing (e.g. financial support like CERB)
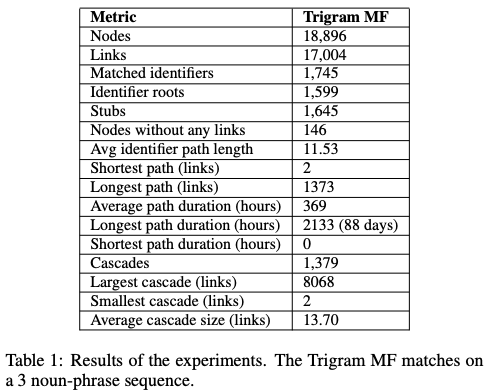
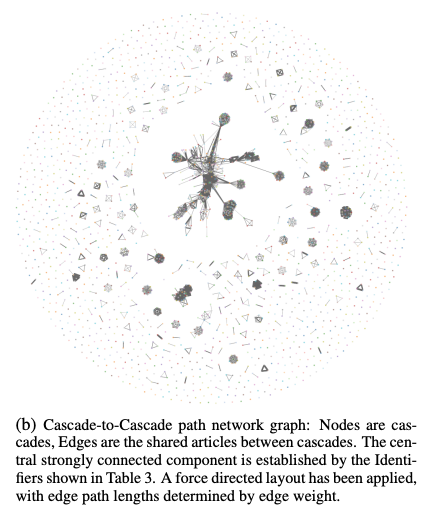
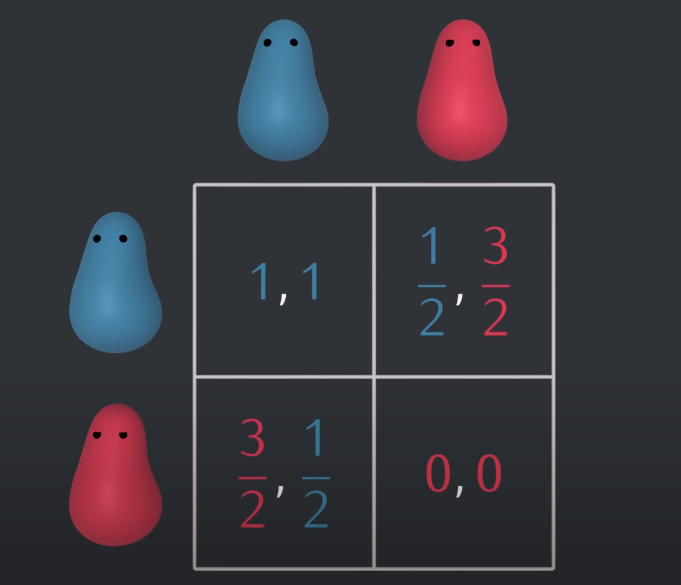
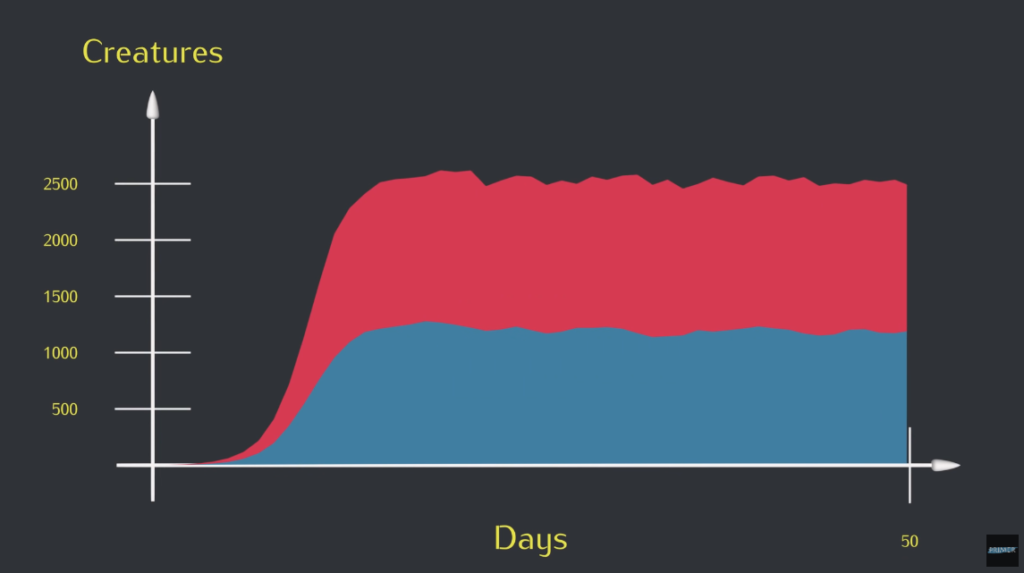


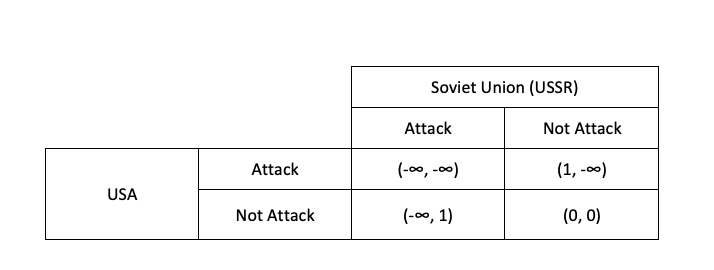
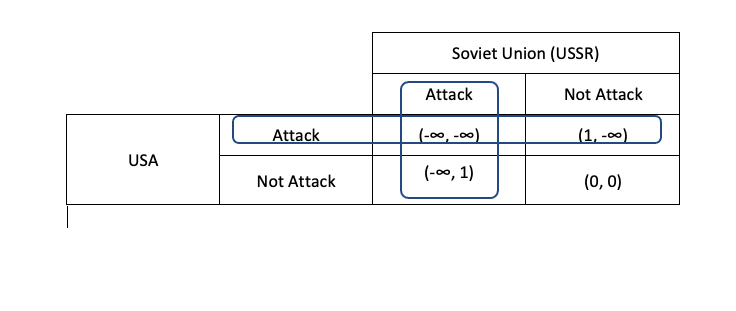
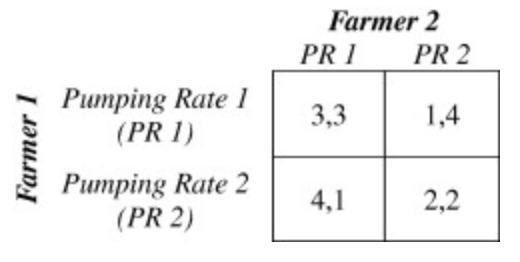
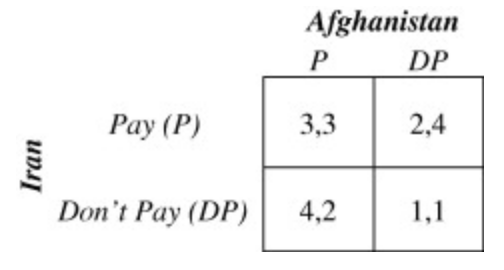
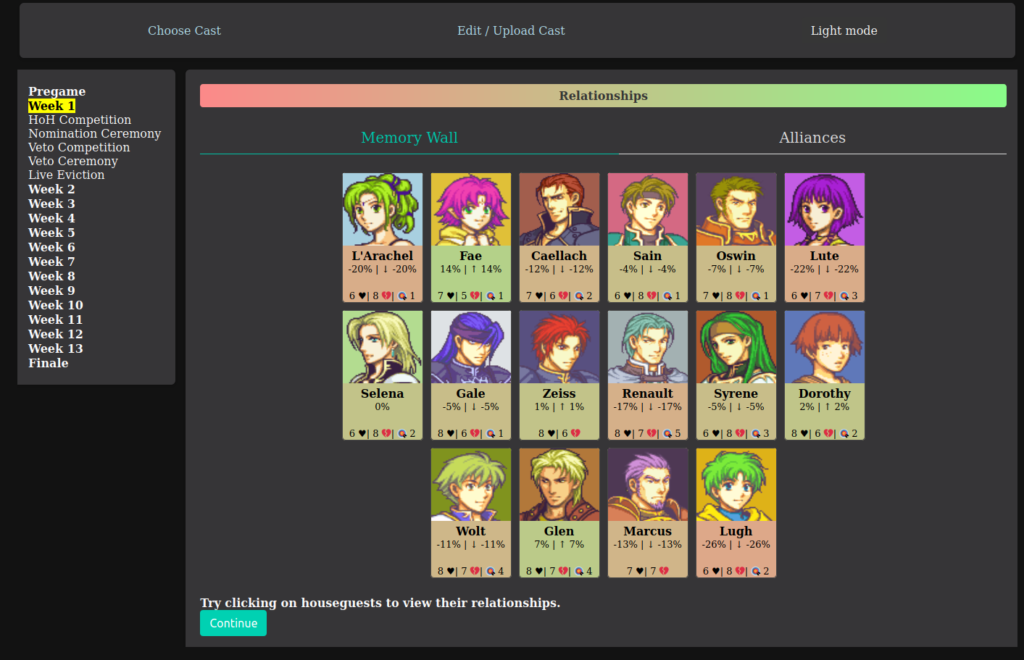
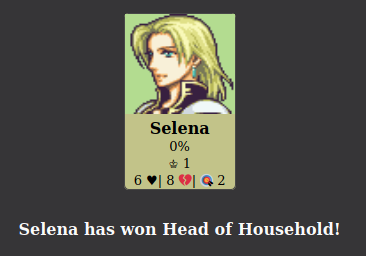
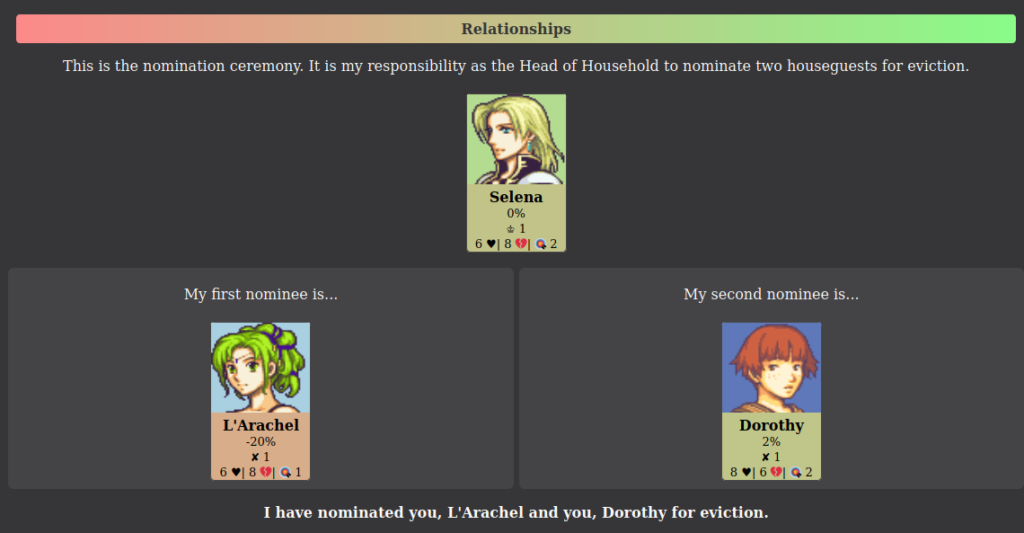
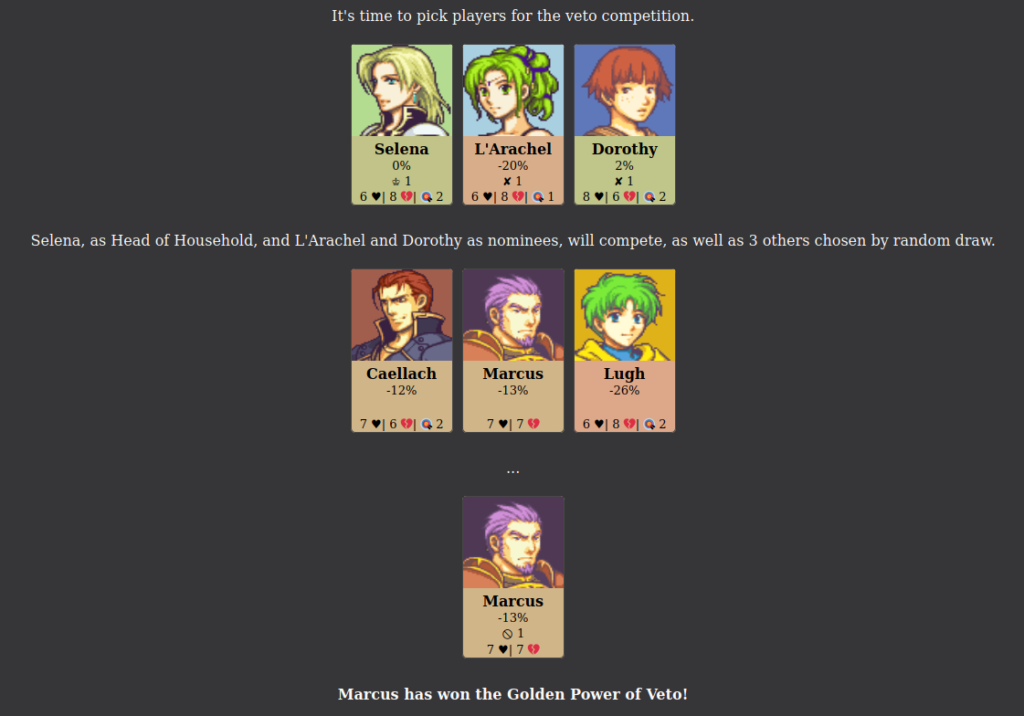
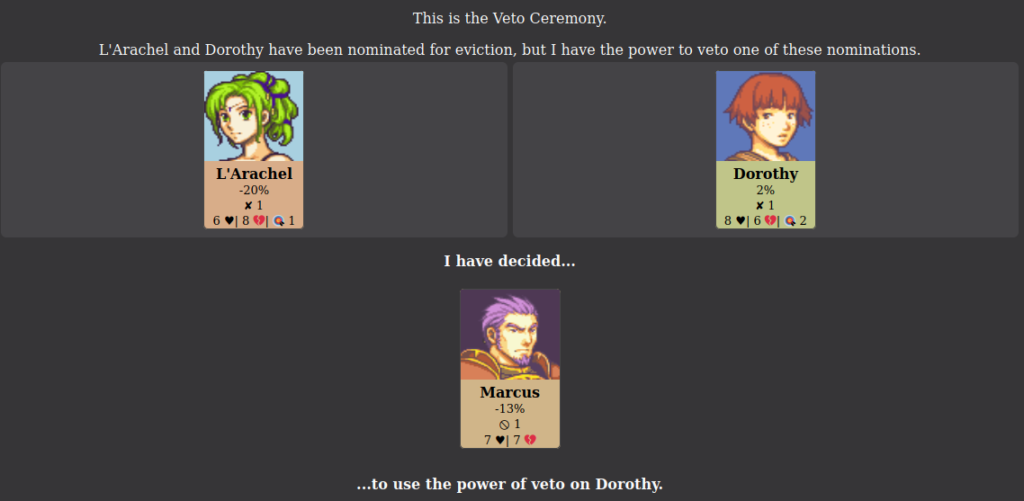
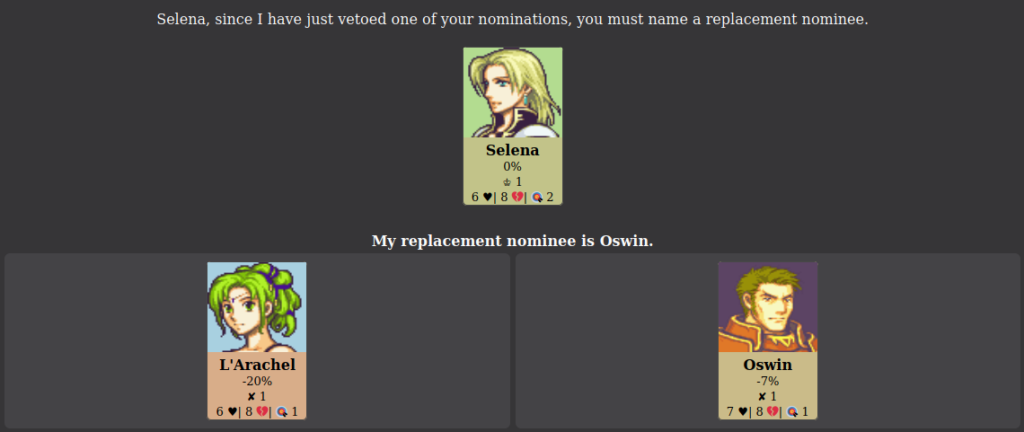
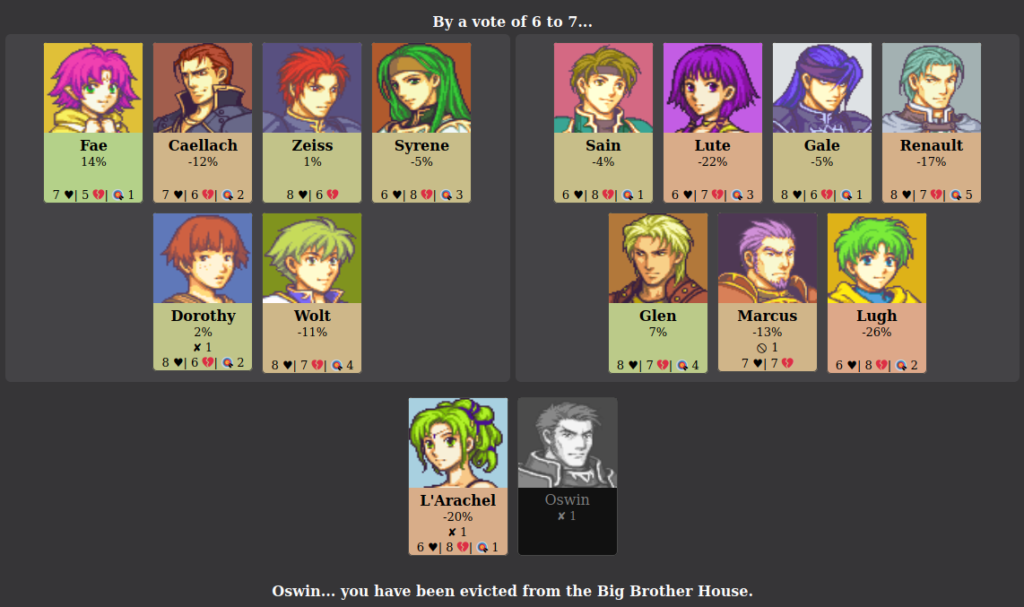
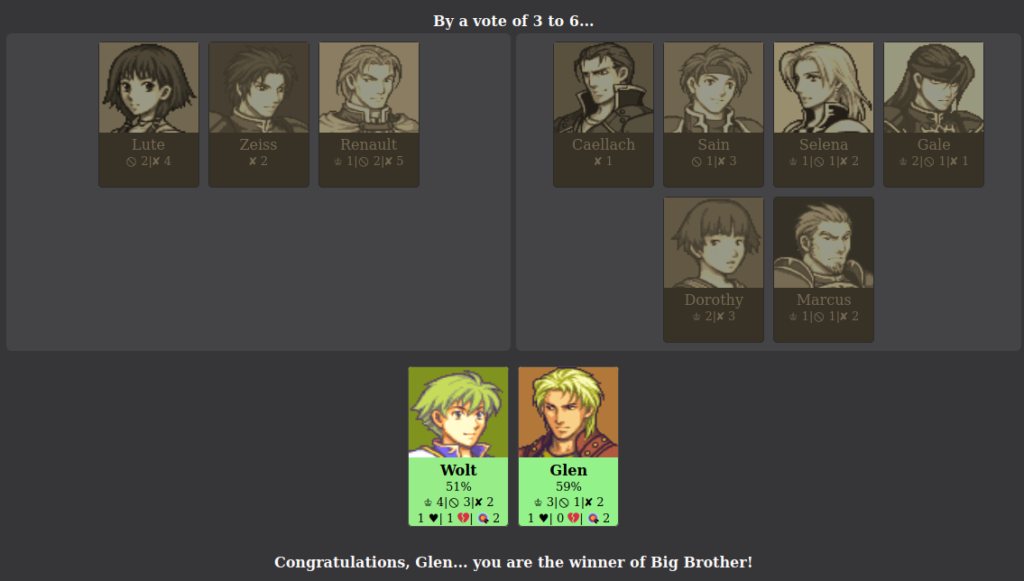
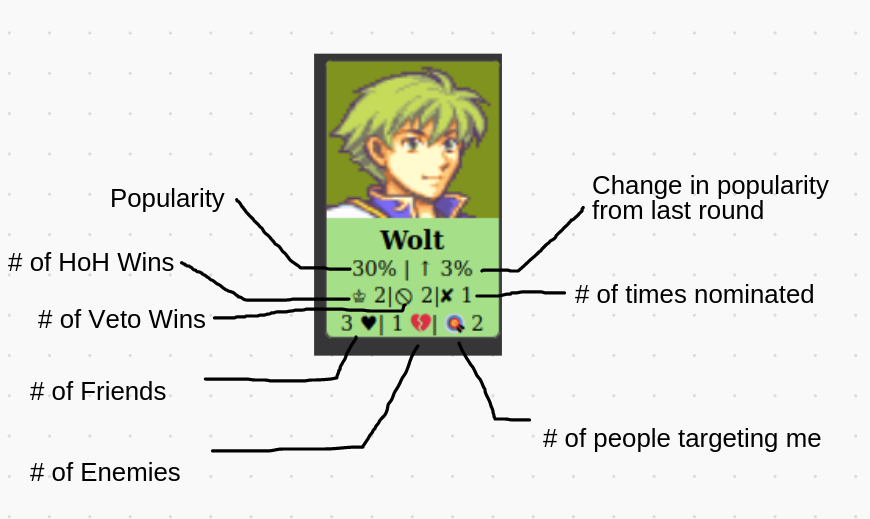
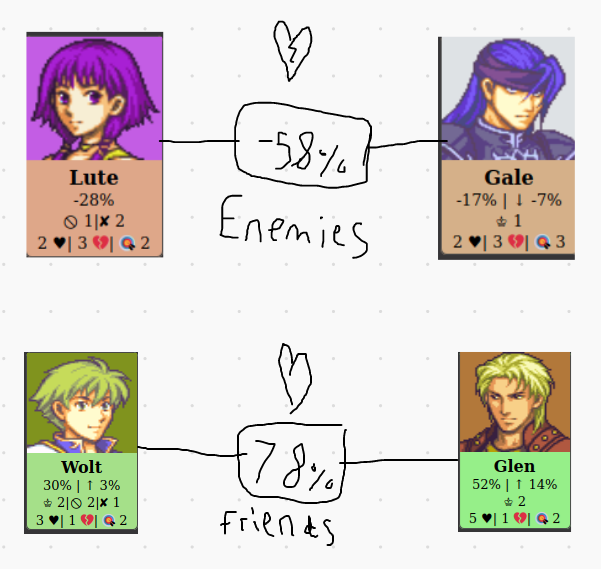
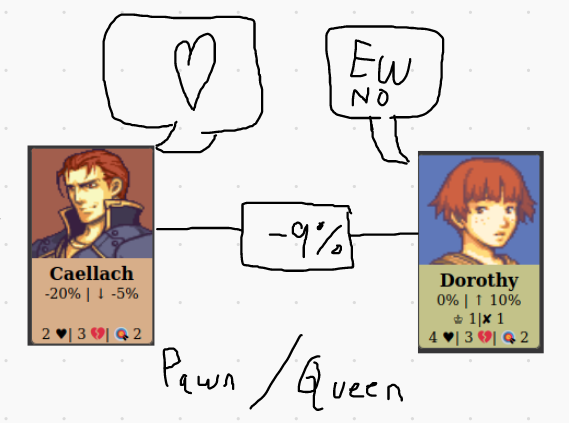
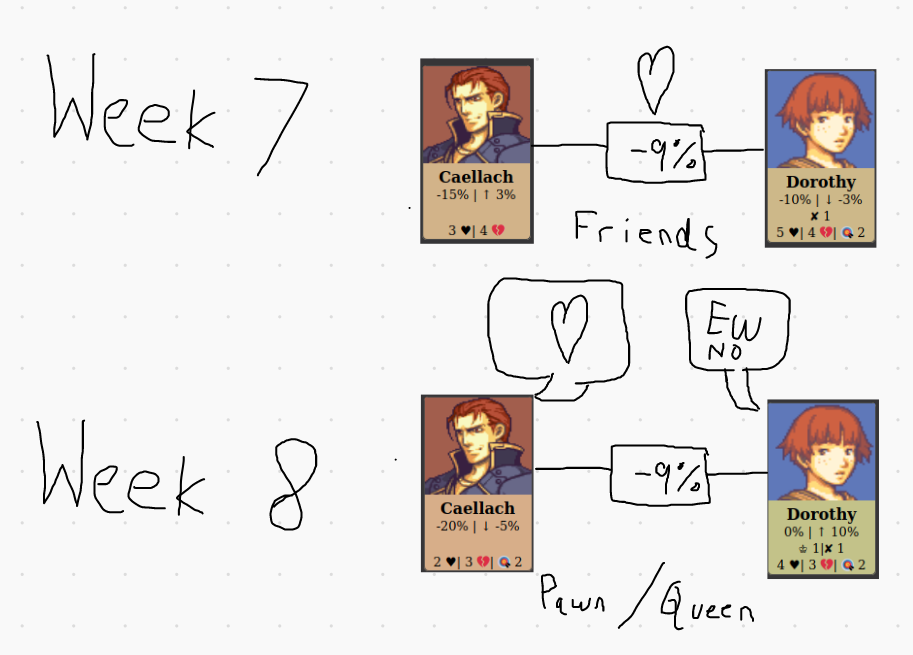
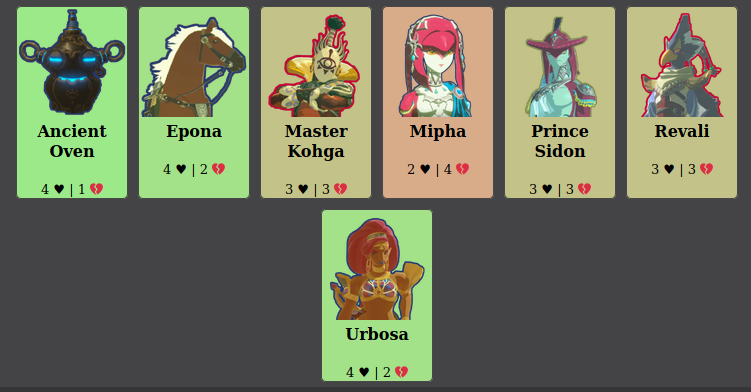
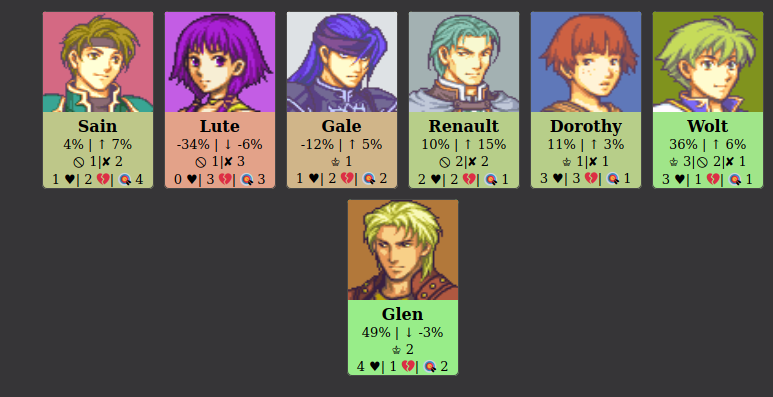
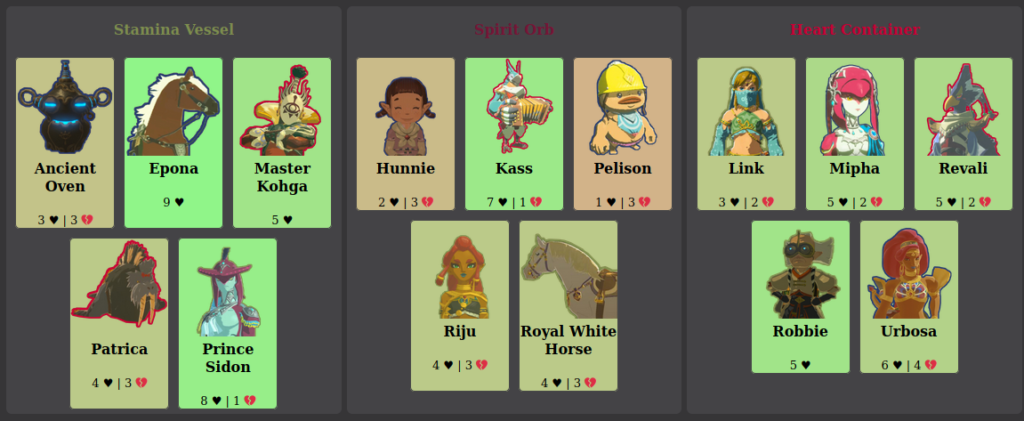
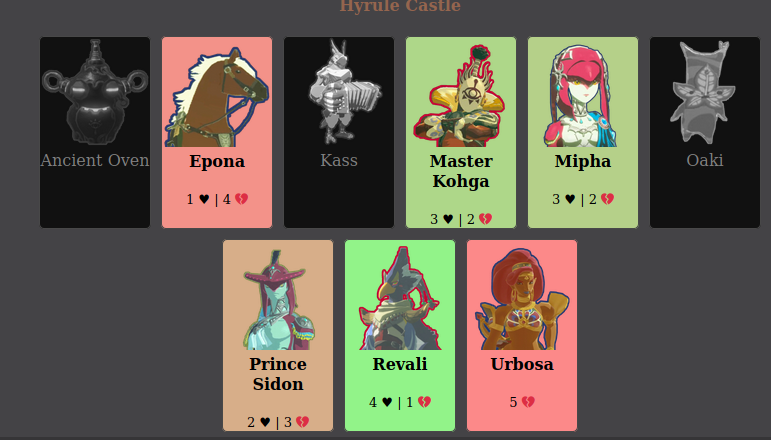
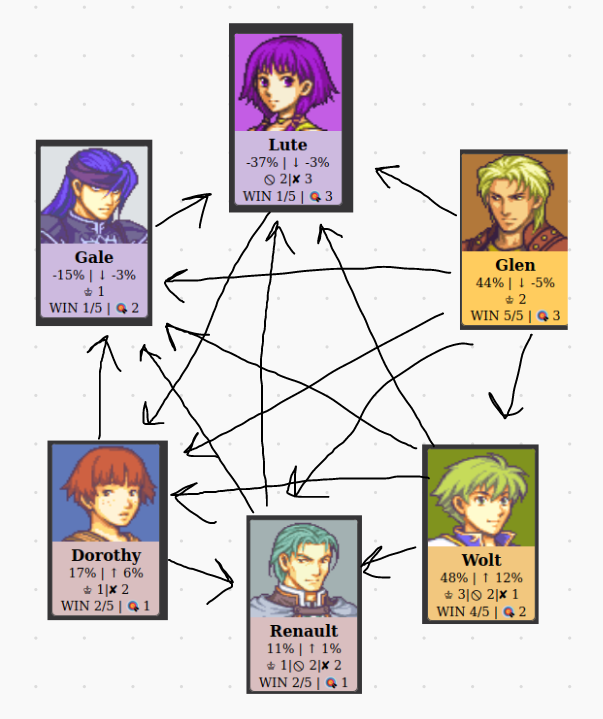
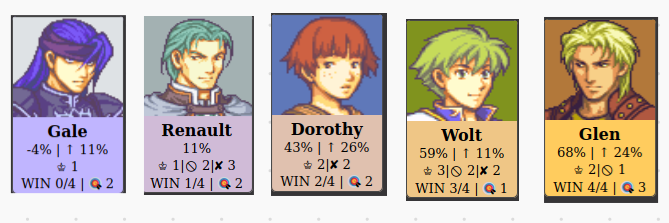
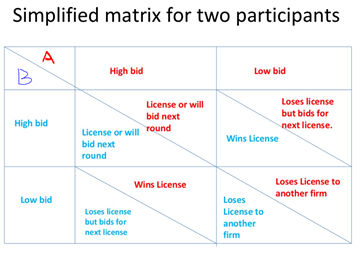
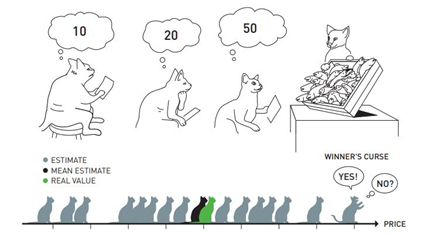
/media/img/posts/2016/04/Untitled_2/original.png)
/media/img/posts/2016/04/Untitled_3/original.png)

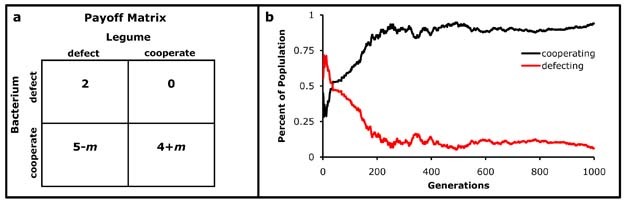
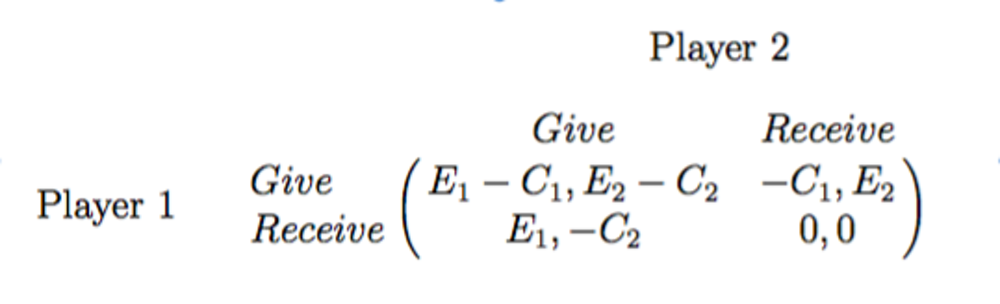
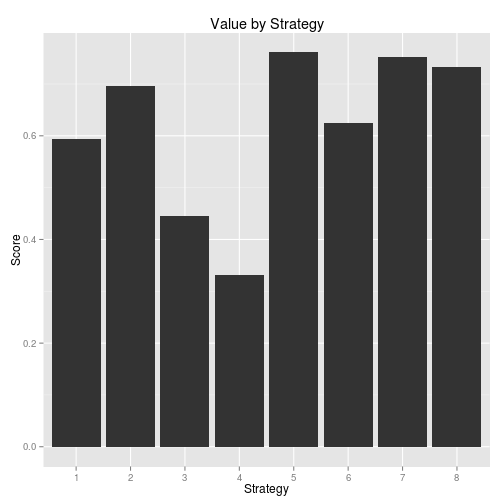
/cdn.vox-cdn.com/uploads/chorus_image/image/66145941/Screen_Shot_2020_01_22_at_3.51.22_PM.0.png)