When considering how individuals are influenced to participate in a protest the expected social theory is that a person is more likely to participate if they are exposed to other socially close individuals who are also likely to participate in the protest. This simple social theory of protest may seem rather obvious and although it is vital to understanding protests there is surprisingly little literature that support this idea definitively. The problem lies in the fact that it is difficult to collect meaningful data that would have traditionally involved surveying protestors after a protest about their behavior and decision to participate. However, a team of researchers were able to solve the data issue by using the network structure of Twitter users and show with clear empirical data that an individual is more likely to participate in a protest if they are more deeply connected to people who are also interested in protesting.
The researchers collected Twitter network and geolocation data on users who showed interest in the Charlie Hebdo protests in Paris by tweeting about it and were either at the protest or located near enough to the protest to be able to attend but did not. The first group of users included 764 users that sent at least one tweet related to Charlie Hebdo and were geolocated to be at the protest. The second group which was a baseline comparison also consisted of 764 users who tweeted about Charlie Hebdo but were geolocated away from the protest but close enough to attend. For each group of 764 users, protestors and non-protestors, the researchers looked at their full Twitter network and for each user collected the list of people they each followed (called “ties” ) and the list of people followed by their “ties” (called “ties of ties”). Using this data, the researchers constructed two graphs, gP and gC, that resembled the network structures of the protestor group and comparison group respectively with all their first and second follow connections.
Similar to what we have done in CSCC46, the researchers then compared the two graphs to identify the characteristics of the protestor graph to see what features are unique to the protestors when compared to the non-protestor comparison graph. The researchers hypothesized that in gP the proportion of each protestors “ties” that are to other protestors will be greater than the proportion of each non-protestor’s “ties” to other non-protestors in gC. Similarly, the researchers hypothesized higher proportions of protestor “ties of ties” to be to other protestors compared to the proportion of non-protestor “ties of ties” to other non-protestors.
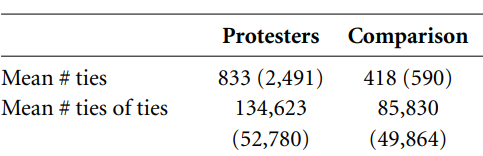
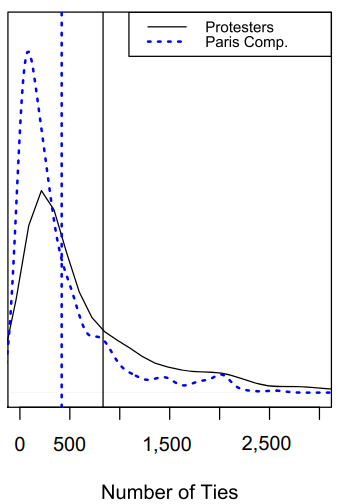
The results showed that there is a considerably higher proportion of “ties” and “ties of ties” between protestors then compared to non-protestors. This suggests that an individual’s choice to participate in a protest is dependent on the choices to participate of close connections.
The final hypothesis made by the researchers is that triadic ties are stronger than non-triadic ties and therefore should on average be more frequent between protestors than between non-protestors.
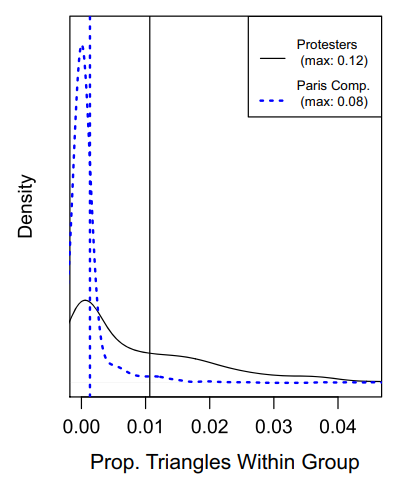
This shows the proportion of protestors’ triangles that also contain at least one other protestor (black) and the proportion of non-protestors’ triangles the contain at least one non-protestor (dashed blue). As expected, the data reveals that the protestor group is significantly more connected with stronger ties than the non-protestor group. The use of Twitter’s network data, its transformation into two graphs, and the comparative analysis done on those graphs allowed the researchers to make strong data driven claims about the social theory of protest. I found this to be a great example of what a powerful analytical tool graph theory can be when dealing with inherently network-like structures.
References:
Larson, J.M., Nagler, J., Ronen, J. and Tucker, J.A. (2019), Social Networks and Protest Participation: Evidence from 130 Million Twitter Users. American Journal of Political Science, 63: 690-705. https://doi.org/10.1111/ajps.12436