Categories
Uncategorized

COVID-19 and the Small World Phenomenon

Article

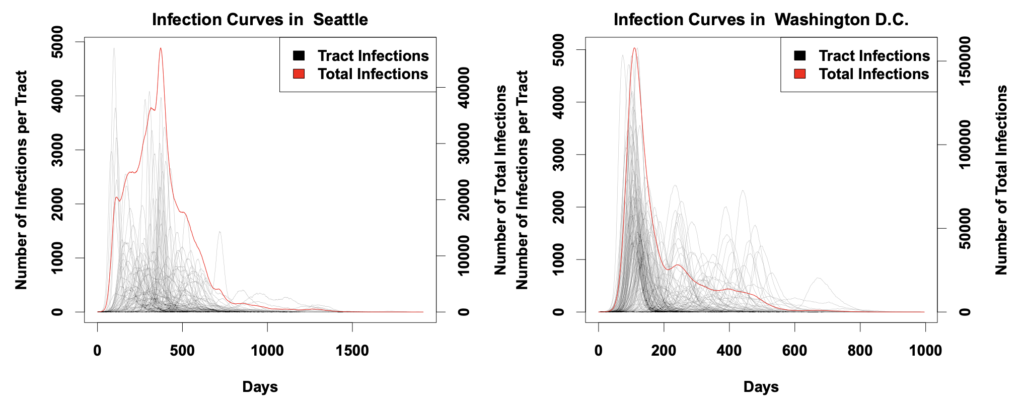
Two students at Duke University, Anna Ziff and Robert Ziff, analyzed data from the COVID-19 pandemic worldwide to learn about “fractal kinetics”. Kinetics refers to the study of the rates of chemical reactions, and fractal refers to an underlying structure of an entity. In this context, the entity is a network representing the rate of spread of COVID-19. This article discusses the relation of power-law kinetics to COVID-19’s growth. The figure below shows 2 different plots of the same data, showing how the death rate increases at different rates during an epidemic.

ziff-2020-power-law-of-covid-19.jpg
Figure 1: Graph of deaths due to COVID-19 in China against the time exceeded in the pandemic

Epidemics usually grow exponentially based on a fixed rate. However, with COVID-19, it was observed that the spread of the virus increased in 2 parts, followed by an exponential drop-off. The 2 increasing parts include:

  • Initially starting off exponentially
  • Transforming into a Power Law

Recently, we have studied power laws in class, which are a distribution. We emphasized the long-tail nature of these distributions and the applications of them in the real world.

Back to the study, the students attributed the spread of COVID-19 to a small world network. This is another topic we have delved into in class where we looked at the high concentration of shorter paths in social networks. This concept is highlighted by the Small-World study conducted by Stanley Milgram. Albert-László Barabási, a professor at Northeastern University researches the Small World Phenomenon. The article refers to Barabási’s book which looks into networks of infectious diseases. These networks are not random but are scale-free, as random networks would indicate exponential growth. In class, we looked into scale-free networks which are networks with a power-law tail in its degree distribution. Here, people have lots of local neighbours and few long-range connections. Barabási claims they follow a power law and have a long-tail as connectedness between people dwindles. This does not represent how fast a virus moves but shows that there are groupings, or hubs, that promote the spread.

The students from Duke use these models to make claims about the speed of the spread and of deaths due to the virus. After one individual is infected, the people in their network interact with them less as they find out they are sick, to try and prevent spread of the infection. Over the period of time the individual is sick, their local network will slowly dissipate as more people find out that they are sick, reducing the rate of infection so it is not exponential anymore. These models are used to make predictions about the number of deaths, and fortunately, the actual death rate has been slower than predicted. If the death rate was still growing exponentially, the mortality count would be much higher. Deviations above the power law indicate that society is doing poorly to contain the spread, whereas deviations below signify that society is doing better than expected.

It is really intriguing to see how graph theory and graph structure can be used to represent the spread and death rate of an epidemic, such as the COVID-19 virus we are currently experiencing.

Categories
Uncategorized

Population Distribution and COVID-19 Spread

The COVID-19 pandemic has taken the world by storm and has changed the way that the world operates. The biggest concern with this dangerous virus is how easily it spreads when protocols aren’t being followed. The University of California, Irvine (UCI), studied the way the COVID-19 virus affects different communities because of how population is distributed. Spatial heterogeneity is a term that describes an uneven distribution in a region; in this case, it refers to the population distribution in different cities in the United States.

The major result from the investigation is that spatial heterogeneity in population distribution causes COVID-19 to affect different places in various ways.

The study was based on network models of 19 American cities, creating using census data. 10 executions of a COVID-19 diffusion simulation were done on the models to observe how the curves of infection form. It was found that the virus spread in “bursts”, where it would transmit rapidly in a community and stall once it reached the edges of the area. An example of the curves obtained can be seen below (Fig. 1) where individual census tract and total infections are calculated.

Fig. 1 Infection curves for the models of Seattle and Washington D.C. collected in the UCI study. It is clear that the tracts are differing in their shapes. Washington D.C. had many more tract spikes after the initial decline of total infections. This also shows that times of peak infection also vary between regions.

Carter Butts, a sociology professor at UCI was a part of the group conducting this study. He talks about social networks, which we are studying in class, and how they relate to the spread of the COVID-19 virus. He speaks on the uniqueness of social networks and how the difference in a network changes how a virus spreads and affects a community. It was cool to note that viral transmission can vary even if different regions are enforcing the same policies to minimize the spread. Some communities tend to lag behind others which gives them a false sense of security, making them comfortable and letting their guard down to a potential infection. This leads to hospitals and other healthcare institutions may not prepare sufficiently when it comes to requesting equipment and creating space for COVID-19 patients. On the other hand, a lag in cases provides a chance to prepare for the eventual sudden surge of cases.

Currently experiencing life in a pandemic, this study really peaked my interest. Learning about networks in class and seeing an application of them in the real world really helps to understand them better. It conveys how diverse and unique our world is, as no 2 networks are the same. This investigation from UCI is also key to the current fight against COVID-19 because it shows there’s a connection between our social networks, and the spread of this virus. The more we know about how it spreads, the better we’ll be able to handle it and minimize its wrath.

The publication of the study conducted can be found here: https://www.pnas.org/content/pnas/117/39/24180.full.pdf