Categories
Uncategorized

The Architecture of a Dream

In this class we have seen how graph analysis can be applied to many different topics of study, some expected and many surprising. A paper published by Martin and collaborators showcases yet another field where graphs can be of help: dream analysis.

The study of dreams can reveal early indicators for mental health disorders, such as schizophrenia or psychosis. They can also give us information about how the brain is functioning during sleep. Our brains undergo different phases of activity during sleep, and the nature of the dreams generated can inform our knowledge of the underlying processes in different phases.

Martin et al. (2020) studied dreams generated during REM and non-REM cycles. Common (non-graph related) ways to evaluate dreams include: recall rate – whether the participants remember the dreams at all, report length – such as the number of unique or total words, or narrative complexity – the story-like organization of the dream as evaluated by external judges according to a defined ratings scale. It is for this last item where Martin et al. employed the use of graphs.

The raw data collected was dream reports, transcriptions of the participants recounting their dreams. To create a graph from a report, each unique word formed a node and edges were drawn between words that appeared consecutively in the report, such as in the figure below.

(Figure 1 from Martin et al., 2020)

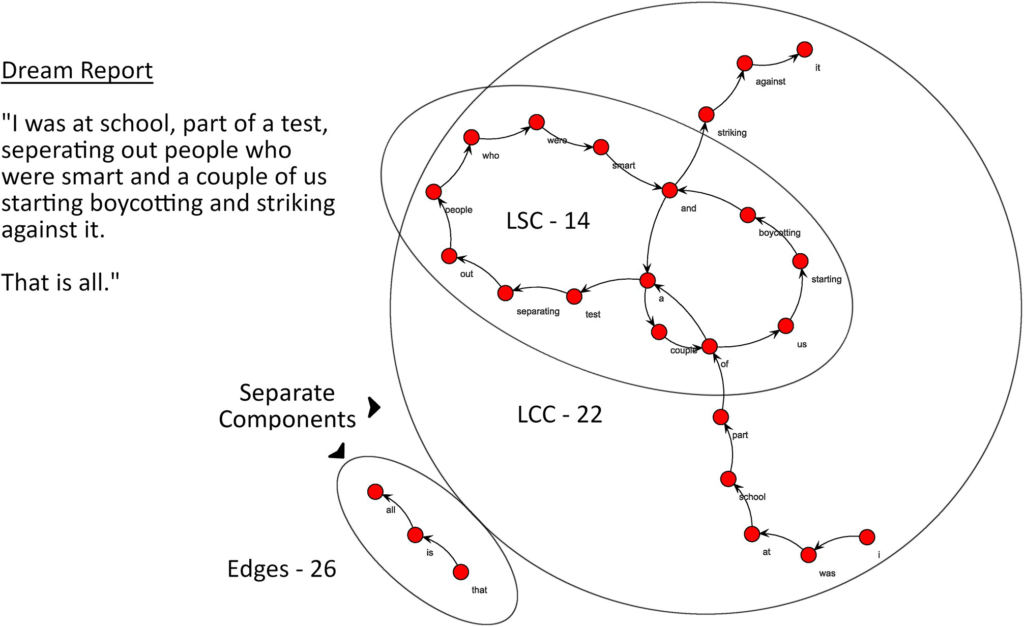
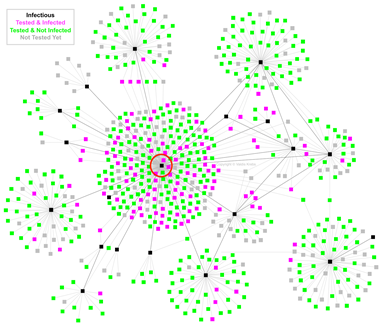
From these graphs, they analyzed the size of the largest connected component (LCC), size of largest strongly connected component (LSC), and random-likeness (resemblance to graphs generated by random chance). They found that larger LCCs and LSCs were indicative of more complex dream reports. Lower random-likeness was also correlated with higher dream complexity. We can see that more connections between separate elements of the story and more unlikely story structure, elements that can make a narrative more complex, is captured in the graph analysis of the dream reports.

The methodology employed in this study was an interesting example of how graph analysis can be applied to data that is qualitative, especially where the relationship between the nodes seems almost arbitrary (order of the words). The complexity of a narrative is a very abstract concept that even with human judgement is difficult to analyze; this methodology lends a new meaning to “a picture is worth a thousand words”.

Source: https://journals.plos.org/plosone/article?id=10.1371/journal.pone.0228903

Categories
Uncategorized

The importance of transmission network analysis

The year is 2020 and the hot topic of the day, month and year is none other than the coronavirus epidemic. In light of this, researcher Valdis Krebs published an essay that illustrates the importance of network analysis in studying the spread of an epidemic.

One example was that looking at communities as a graph of the social networks and connections can reveal where the clusters are within the network. Clusters, especially if strongly connected, have many more connections between persons within the cluster than outside the cluster, and there are often many shortest paths from one person (node) to another. In the job-seeking situation we looked at in lecture, we concluded this could lead to less success in hearing about new job positions since this leads to many redundant connections and thus not much new information. In the context of an epidemic however, it has much more dangerous implications as it would mean that there are more paths a disease can use to spread from one person to another; this is in line with the intuitive notion that a disease will spread faster in more tightly-knit communities.

Another item to consider is the nature of the relationship between two persons. In class discussions we have identified that a weak point of depicting real-world networks as graphs is that it is difficult to portray the strength of the relationship between two nodes. An edge between two nodes could represent a close friendship or a passing acquaintance made years ago. Krebs shows the importance of considering the relationship strength in an example from a past outbreak of tuberculosis, which was eventually traced back to the first person, or patient zero.

In the above figure from Krebs’ essay, we see a black dot in the center, which represents patient zero. From the graph we can see that this person had many interactions with people and so had many chances to spread (or not spread) the disease. What made this person dangerous in terms of disease spread was not that they had a large number of close friends and family, but rather that they had a large number of interactions with people they were not close with. Since they had little or no relation to those people, this patient zero was extra difficult to identify and track down. As a result, public officials were not able to bring him in for testing earlier which could have helped curb the outbreak.

While it is true that those closest to the infected are at the highest risk of becoming infected, those who are not close are at least equally, if not more important to identify. This relates also to the idea of bridge edges we studied in class, where certain people may serve as the link between two communities or clusters. Though we may have acquaintances or people we see regularly that do not play a big role in our lives, it is precisely these people who become key in an epidemic, as through them a disease can travel from one community to another.

Krebs’ essay was a genuinely interesting and straightforward read. I highly recommend it to any classmates who would like to see how our class material can be applied to a current global issue.

Link to the essay: http://orgnet.com/TNA.pdf