Categories
Uncategorized

Playing Tetris with PageRank

When Google created founders Sergey Brin and Larry Page created the RageRank algorithm in 1998, I doubt they realized how many applications it would have, and that one of those applications would be playing Tetris! In this blog post, I will analyze how Artificial Intelligence and PageRank can used to play a near perfect game of Tetris.


In Tetris, the goal is to stack pieces on top of each other without reaching the top of the board, where each piece is four blocks connected together. You can clear lines by filling an entire row of spaces, where each row is ten blocks long. A common strategy is filling a nine by four space with pieces, then using a one by four piece to clear four lines at once. This is called a Tetris.

An example of a nine by four stack, with a one by four piece ready to be dropped to complete a tetris.

We can use PageRank to build efficiently build a nine by four stack with no holes. With this, we can continuously create the opportunity for Tetris’ regardless of the order of pieces we are given. First, we define our nodes and edges. Our nodes are the contours of the stack. Each stack surface is represented a list of numbers in between -4 and 4, where each number is the change in height between columns in the stack.

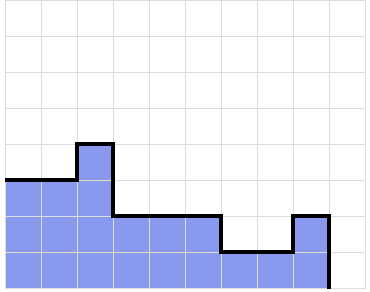
Currently, the list of numbers representing this stack is 0, 1, -2, 0, 0, -1, 0, and 1. This can be represented as a positive integer value, with each number in the set incremented by four. Thus, this surface contour is represented as a node with the identification number 45244345. If adding a piece to a surface contour A will create a new surface contour B without creating any holes in the stack, then we say that node A points to node B.

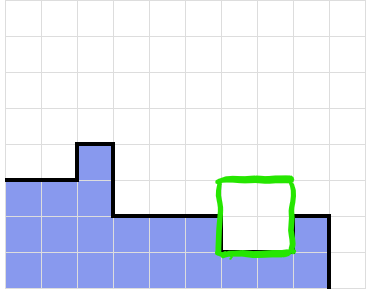
If a piece was added to this position, node 45244345 would link to node 45244543. With this, given a surface and a new piece, we can calculate all the new possible surfaces by simulating all possible piece placements that do not create a hole in the stack. We then record the results of this simulation as a graph. Finally, with this new graph, we iteratively calculate the rank of each surface following the PageRank algorithm.

When playing Tetris, players are given a random piece. Using this piece and the players current surface, we place the piece in the position that forms the surface contour with the highest page rank. Following this, we continuously stack pieces in nine by four fashion until we reach a certain height in the stack. When this height is reached, we use a one by four piece to create a Tetris, clearing four lines and lowering our stack.
This works because the only way to lose at Tetris is to have your stack touch the top of the board. For this to happen, you must be unable to clear any lines, and for a line to be unclearable, there must be a hole in the stack that gets covered by another piece. In our page ranking algorithm, a node’s rank corresponds to how likely the stack it represents is to not lead to stack contours with holes in future moves. By this logic, following the highest page ranks minimizes the likeliness of creating holes in the stack. Therefore, we can be sure the moves that are being made result in the smallest chance of losing.

Sometimes in Tetris, players are given a “next” bar, that shows the next upcoming pieces that are going to be given to the player. With this added information, we can “look ahead” and find the highest page rank along a path as opposed to the highest page rank across just one link. It turns out that having this extra look ahead drastically changes the number average consecutive moves where no holes are made.

Average number of consecutive pieces that create no holes after 15 iterations of the PageRank algorithm.

I think using PageRank in this way is interesting because it is a unique and creative way to play a game. The fact that PageRank can be used this way is astounding because it shows an application of the algorithm outside of data analysis. Another byproduct of this is that by analyzing the weight of the links created with the PageRank algorithm, we mathematically define that some orientations are better than others, and that each piece has an optimal placement when given a stack contour. The author created some guidelines to follow to achieve optimal piece placement during a game of Tetris, which is linked to below. I chose to write about this because I personally am avid player of Tetris, so I thought it was interesting that a PageRank algorithm could apply to the game. Finally, this relates the class material because we are learning about PageRank in class. This article also forces the reader to think deeper about the implications of a node having a high rank.

Sources:
https://www.ryanheise.com/tetris/tetris_artificial_intelligence.html
https://www.ryanheise.com/tetris/tetris_stacking.html

Categories
Uncategorized

The Importance of Social Distancing

As we all know, we are currently in the middle of a pandemic. With COVID-19 wreaking havoc on a global scale, the world has put some new rules in place. One of these rules is social distancing. Today, I’m going to do an overview of how social distancing can affect the spread of a virus. This content matters to us because as of the date this is being written, we are in stage 3, but over 700 cases of COVID-19 were reported for the day before yesterday alone in Ontario. It is important to see this type of data and acknowledge why we should try to stay inside and social distance. The following study tells us what the peak infection rate is for certain levels of social distancing, which is when our health works are struggling the most and when all the hospitals are full. I chose to write about this topic because I think that it is important to take COVID-19 seriously, and that following the rules put in place by the government can help fight the pandemic. This content directly relates to the course material because in this study they use a randomly generated graph to study the affect of a virus on a population. Specifically where we use the Erdős–Rényi model, because in lecture last week we went over the model and how it works.

First, three graph models were chosen. The models are as follows: the Erdős–Rényi model, the same one from class which randomly picks nodes and edges to be connected, the Watts-Strogatz Model, which produces a locally clustered network with low average path lengths, and the Barabási–Albert model, which is meant to closely simulate real world networks. In this simulation we followed the SIR model. In this model, S is people susceptible to catching the disease, I is people currently infected and able to spread the disease, and R is the people who have been removed because they received the disease and can no longer spread it that being through either immunity being developed, death, or some other circumstance. Infected nodes spread their virus to a Maximum of N people with probability p. N is defined as the maximum number of other nodes a single node can interact with due to social distancing.

The three graph structures below were randomly generated with 1000 nodes, with the average degree for each node to be 10. In the simulation we set p = 0.03, and the probably to start as an infected node as 0.01. After being infected, the chance to be removed from the graph was 0.1. The simulation was run 1000 times for each type of graph.

When analyzing all these graphs together at first glance, they show that when social distancing is at its tightest value (maximum 2 people allowed), in 40% of trials the peak infection rate never goes above 5%. Alternatively, with basically no social distancing (N is unbounded), the infection rate spreads at an average of approximately 25% across all graphs. This highlights the importance of social distancing, as it drastically curbs the peak infection rate. This data is especially important when looking at the Barabási-Albert distribution, as it is what closest resembles social networks in real life. With a deeper analysis, we can see that setting max N = 2 eradicates the infection completely in ~70% of the trials, setting N to 5 eradicates the disease in slightly more than ~10% of the trials, and setting N = 10 almost never eradicates the disease, and setting N = infinity never eradicates the disease for any kind of network.

Consider the event where after social distancing ends (t=50), the virus was not eradicated. We continue to analyze the data and look at the probability of achieving herd immunity. When social distancing is very strict, e.g. N=2, the peak infection rate is reduced, but society becomes more susceptible to further epidemics. When social distancing is less strict e.g. N=5, it seems that the pandemic occurs after social distancing ends, while it occurs before social distancing ends when N=10. It seems that for acquiring heard immunity, the best policy is setting N=10.

While analyzing this data, it gives us some great insight as to how social distancing affects the spread of a pandemic and the affects of a pandemic on heard immunity. However, when comparing to our current situation with COVID-19 to this simulation, differences arise. First, the transmission rate for the virus here was a mere 3%. COVID-19 has a much higher transmission rate, and this could drastically affect the results. Secondly, in this simulation, when people got infected, they eventually changed to people who were removed from the simulation. While achieving herd immunity is good, during analysis we did not recognize the intensity of being infected and becoming removed. When the infection peak is high, hospitals become crowded. As more hosptials become crowded, more and more people fail to receive treatment and die. When removing nodes from the graph, this simulation fails to acknowledge the massive loss of death that occurs with having a high peak infection rate. While looking at herd immunity may be inticing, we need to carefully evaluate the risks of having a high infection peak. In this simulation, we decided that everyone who ends up not being infected is removed entirely. Realistically, we have seen cases in Hong Kong and China where people who recovered from the virus once got it again. This possibility is not seen in this simulation, but is important to think about.
In this blog post, we do not analyze the effect of essential workers – these are people who do not follow social distancing rules because of their jobs. Thus, for the first 50 days, they would have a much higher affect of spreading it to other people. We also did not consider how two separated groups of nodes with one group social distancing and one not, would affect the spread of the virus. This would let us see the effects of a country not following social distancing rules and watch the effect of that country on the rest of the world. This would show us the importance of global participation in social distancing to stop the pandemic.
From this study, we learned the importance of social distancing. We used random graph models to simulate how social distancing affects the spread of a virus. We learned about what would happen if a virus was not eradicated after social distancing was lifted, and what the best choices were to achieve group immunity. With COVID-19 rampant and cases quickly rising again, data like this is worth its weight in gold.
https://arxiv.org/abs/2005.03067