Sport Leagues such as the NBA are entering a new age of statistical analysis with teams trying to come up with new techniques from statistical analysis to gain an edge over their competitors. Houston Rockets has been in the lead in taking basketball analytics to the next level. Spearheaded by Daryl Morey, Houston Rockets GM, a former consultant and MIT Sloan Graduate who did not play basketball, his prior work as a statistical consultant helped him gain a deeper understanding of basketball and how teams operate inefficiently. Morey’s fundamental insight involved taking a tremendous amount of three-point shots, although more difficult than midrange, or driving in the paint, they boast a slightly higher expected value. Morey also recognized that three-point attempts made from the corner had a higher percentage of going in because the shape of the three-point line made it slightly closer to the basket, many of the Rocket’s set plays are specifically designed to get strong three-point shooters open for these corner threes. The Rockets are shooting more 3s than should be humanly possible, and it’s working.
The introduction is one of many examples of statistics taking over the sports leagues around the world. One of the biggest problems in sports is coming up with an accurate ranking for how good the teams are.
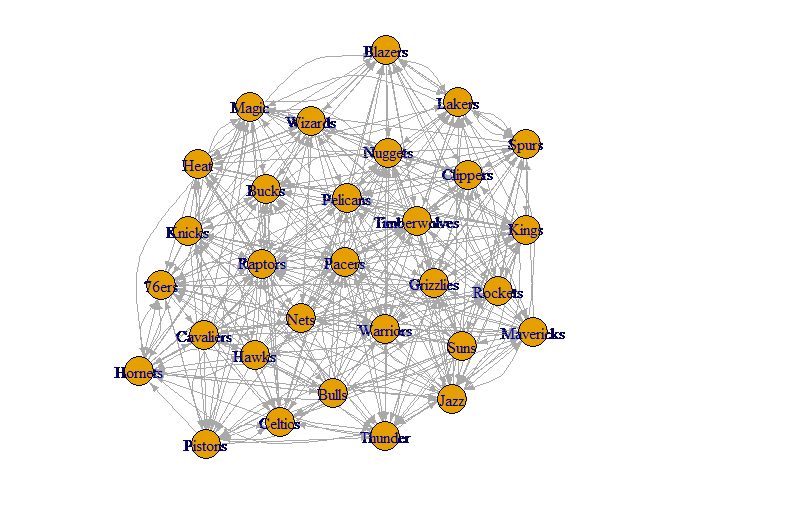
This graph was constructed where the for every win team X has over Y, the weight of the arrow increased by 1. Using this graph, we can apply the Scaled PageRank algorithm until convergence to produce the PageRank score for each team.
This is a simple and elegant way to rank NBA teams and so with the Lakers winning the 2020 champion ship last month, I have heard a lot of talk regarding how they had a relatively easy path to the finals and didn’t face much competition. I thought this was quite interesting so I decided to make a YouTube video where I use the PageRank algorithm to rank the teams in the last 6 seasons, and find out which championship runs were more competitive than others.
In the video, I constructed a directed graph of each of the NBA teams, then for every win team X has over team Y, the weight of the directed edge (X, Y) was incremented by (final score for X/final score for Y), and suppose team Y wins against team X, then the opposite directed edge (Y, X) was incremented by (final score for Y/final score for X). I was hoping that this would create a more accurate depiction of how the teams fair against each other because many wins are competitive, going to multiple overtimes where as some other wins are complete blowouts. For example on Sunday, Nov 3rd, 2019, the Miami Heat smacked the Houston Rockets with a 129-100 victory. Then next day, the Rockets beat the Grizzlies 107-100. I thought that these wins should be treated differently to create a more accurate depiction of how the teams match up.
After running the PageRank algorithm on all 30 teams from the 2014-2015 season, I plotted the highest ranking team (green) and and teams that won the championship if the highest didn’t win (red). This goes to show that the best team doesn’t always win and that there are many other random factors that determines which team ends up with the championship.

Skipping over some plots, the most important one was the following. Here by looking at the average playoff opponent PageRank scores of each championship team, we get to see how ‘hard’ it really was for them to win.

Through this graph, we see that the claims of Lakers having an easy championship run is false (outside of injuries). As the only team that has faced better opponents in the playoffs in the last 6 seasons was the Cavs back in 2016, and that was mainly because in the finals they played the Warriors who had an astounding PageRank of 0.0650, highest of any team by roughly 0.005 in the last 6 years or so.
Source: https://www.samford.edu/sports-analytics/fans/2018/Google-PageRank-A-New-Metric-for-Gauging-NBA-Team-Quality
Source code: https://github.com/H-Richard/NBA-pagerank