Categories
Uncategorized

Game Theory and Presidential Elections

Now that the 2020 US presidential elections are on the verge of concluding (as of writing this article), the whole world awaits for the results. The fate of the candidates are decided by voters and therefore, to understand the results of an election, we need to go into the minds of the people who voted. Why did a voter pick a particular candidate over the other? What factors could have influenced their decision? What was their rationale? As we will see, presidential elections are nothing more than just a game (a rather complex one). However, in principle, it is very simple. We will make use of a much simplified version of the elections to understand this very principle, employing the use of game theory to dig into the minds of the voters.

In the “toy” election we are about to study, we have 5 voters from A-E and 5 candidates from 1-5 such that candidate 1 and 5 are opposites in their views (democratic vs republic). We will inspect multiple “games” and see how the situation is played out in each of these “games”. There is a utility function that compares the result of each game. We study whether the Nash equilibrium is optimal for the voting system.

Figure 1

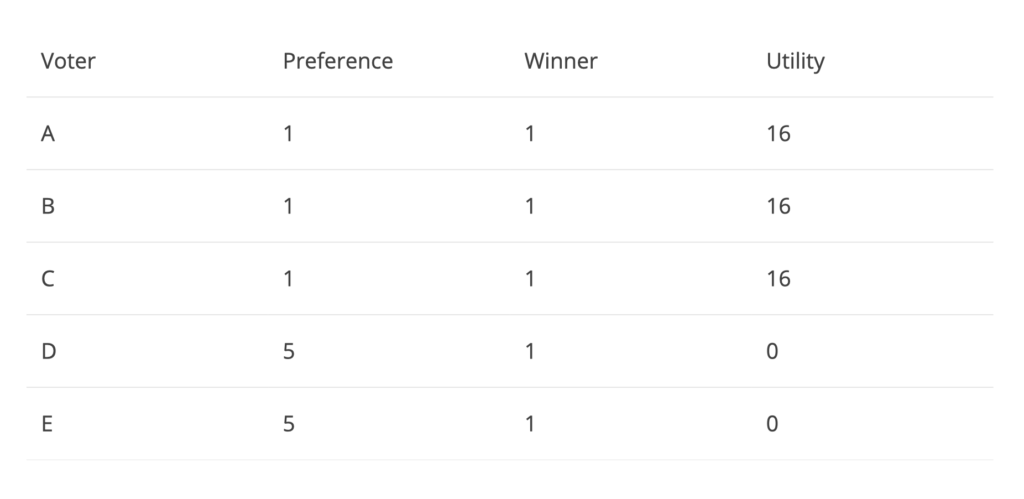
In the above game, voters A, B and C prefer candidate 1 whereas D and E prefer for 5. In this situation, Nash equilibrium will be achieved only if the voters have no incentive to deviate from their preferential candidate and hence each voter will vote for their preferred candidate. We can see that since voters A, B and C voted for the winner of the elections, 1, their utility can be said as 16 whereas D and E had no utility since they strongly voted against 1 and instead of the other side of the spectrum by voting for 5. The total utility is 48 for the above example. Let’s see if we can improve this result of Nash equilibrium.

Figure 2

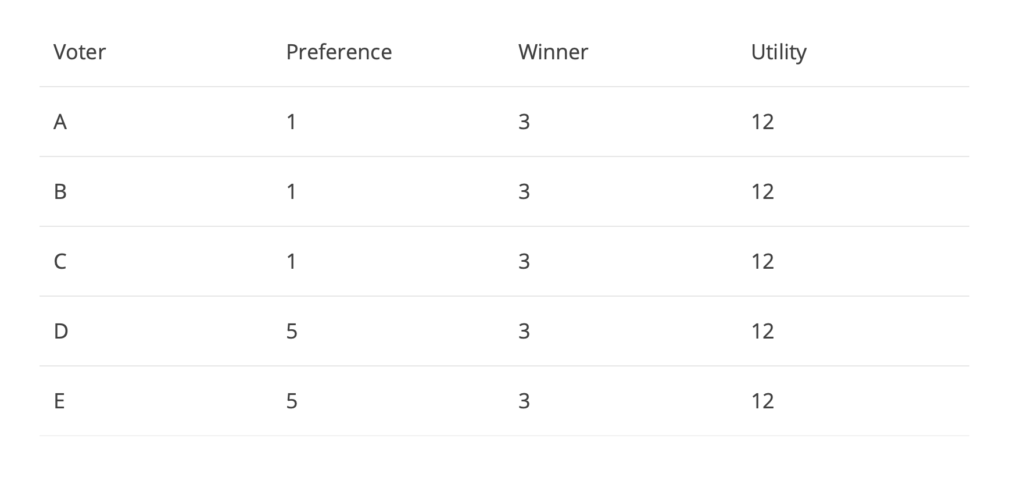
In the above situation, somehow the winner is 3 even though none of voters A-E voted for 3. Candidate 3 can be thought of as a neutral candidate which is not strongly disliked nor strongly liked by voters A-E. The total utility of this game is 60. We can see that the outcome overall, is better the in Figure 1 even though the winner was a candidate not the preferred candidate for any of the voters. The above example explains how voters cannot predict how others will vote and hence, they simply pick whichever candidate they prefer the most, even if the result is not optimal. Now let’s consider another game:

Figure 3

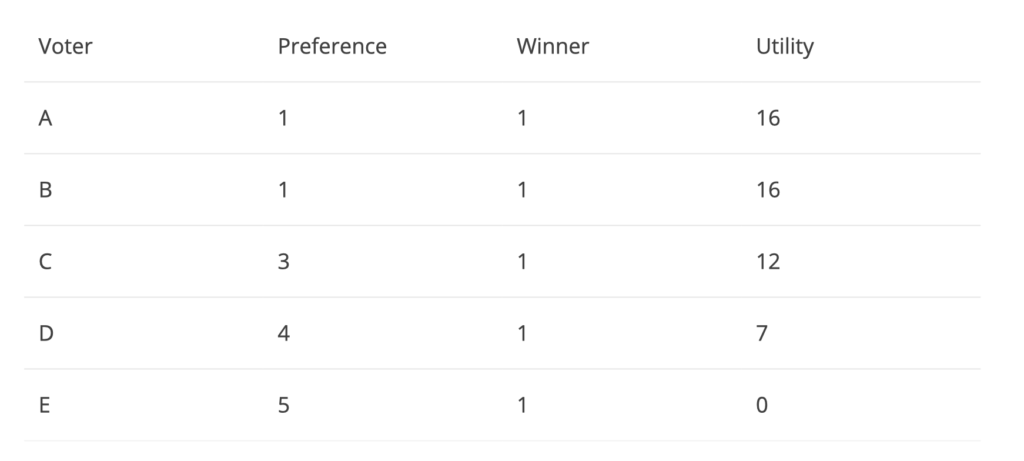
This situation is similar to the one in figure 1 with a utility of 51. This time, we will follow this up with the next elections (4 years later) where the voters can see the results from the previous elections. Voter D prefers 5 over 4 and can switch his vote over to 5 during the next elections. Hence, it all comes down to the neutral voter C. He/she neither strongly likes nor strongly dislikes candidates 1 and 5. C can simply “throw away” their vote to either 1 or 5 and can be indifferent to the outcome of the election. Say C throws his/her vote to E. Then in that situation, we can observe the following:

Figure 4

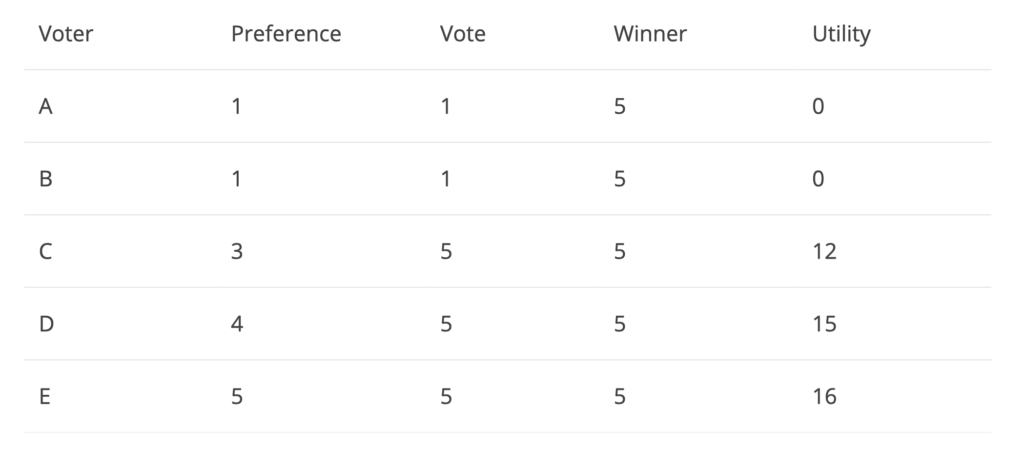
Since voters A and B Strongly dislike the winner – candidate 5 and hence vote against 5, they have no utility. Notice how C votes for 3 even though he/she prefers 3. Since the previous round of elections showed that 1 and 5 are the main polarizing candidates, C would like to have some representation over no representation at all by voting for one of the two polarizing candidates. Calculating the utility of the above game results to 43, which is worse than what we obtained in figure 1!

Looking at the games above, sometimes voters A and E are extremely satisfied with the results whereas sometimes they are extremely dissatisfied, producing suboptimal results. If voters such as C did not swing to either end of the spectrum to have some kind of “representation” (1 or 5), they could remain in moderate and hence resulting in an optimal election outcomes as in Figure 2. The government needs to modify their election system to switch to a better one where the results are moderate and produce the most optimal results. Otherwise, the country will be left in a situation where some citizens strongly dislike the president and some strongly like the president, which has been the state of the US over the past 4 years.

Reference:

Categories
Uncategorized

Graph Theory Solves Crimes

Based on my “extensive” knowledge about police work from binge watching Brooklyn 99, I can conclude that most crimes involve suspects which are narrowed down by detectives to find criminals. These detectives investigate suspects by questioning them and come to a conclusion based on all the evidence they have gathered. So where does graph theory fit into all of this if Jake Peralta can seemingly solve every case that falls upon his lap? Well, it’s possible to significantly reduce the time taken to solve a crime with a few nodes and some basic math. We will consider a simple, but powerful example that displays the topic of discussion.

Jake is stuck on one of his cases and needs YOUR help in figuring out who the criminal is! There has been a fire at a local pizzeria (luckily nobody was injured). Arriving at the crime scene, Jake concludes this was an arson and gathers witness reports to understand more about the crime. After conducting a brief investigation, he comes to the conclusion that one of the owner’s of local competing pizzerias is responsible for the arson. The owners of these pizzerias are – Aidan, Brandon, Clara and David. Jake begins interrogating these four suspects. The following are their statements:

  • Aidan: “I did not commit the crime”
  • Brandon: “Aidan committed the crime”
  • Clara: “Brandon committed the crime”
  • David: “I did not commit the crime”

Jake is confused and has no clue who the real arsonist is. Let’s use some basic graph theory to help him out.

Complete graph

When suspect X says that he/she did not commit the crime, he/she is implying one of the other suspects committed the crime. Aidan states that he did not commit the crime. Hence, he is implying that it was either Brandon, Clara or David. So let’s draw a directed edge from Aidan to every other suspect. Now, Brandon claims that Aidan committed the crime. Therefore, we draw a directed edge from Brandon to Aidan, implying Brandon is accusing Aidan. We do the same with Clara and David to come to the graph depicted in the picture above. Now, based on the interrogations, we can clearly see that not everyone is telling the truth. Let’s assume that there is only one criminal and out of all the suspects, only one is telling the truth (we will see why later).

Graph when Aidan is the criminal

Hypothesis: Aidan is the criminal

Let’s assume Aidan is the criminal. This implies that Brandon, Clara and David did not commit the crime. We also know that only one suspect is telling the truth (based on our assumption). Hence, looking at their statements, Aidan is lying when he says he’s not the criminal, Brandon is telling the truth when he says Aidan is the criminal, Clara is lying when she says Brandon is the criminal and David is telling the truth that he did not commit the crime. However, we can see that 2 suspects are telling the truth which is a contradiction to our assumption (only one person is telling the truth). Hence, Aidan is not the criminal.

Graph when Brandon is the criminal

Hypothesis: Brandon is the criminal

Let’s assume that Brandon is the criminal. Therefore, Aidan is telling the truth when he says he’s not the criminal, Brandon is lying when he says Aidan is the criminal, Clara is telling the truth when she says Brandon is the criminal and David is telling the truth when he says he’s not the criminal. Here, 3 suspects are telling the truth which is a contradiction to our assumption that only one person is telling the truth. Hence, Brandon is not the criminal either.

Graph when Clara is the criminal

Hypothesis: Clara is the criminal

Let’s assume that Clara is the criminal. Therefore, Aidan is telling the truth when he says he’s not the criminal, Brandon is lying when he says Aidan is the criminal, Clara is lying when she says Brandon is the criminal and David is telling the truth that he’s not the criminal. Here too, we see that 2 suspects are telling the truth which is a contradiction to our assumption that only one person is telling the truth. Hence, Clara is not the criminal.

Graph when David is the criminal

Hypothesis: David is the criminal

Let’s assume that David is the criminal. Therefore, Aidan is telling the truth when he says he’s not the criminal, Brandon is lying when he says Aidan is the criminal, Clara is lying when she says Brandon is the criminal and David is also lying when he says he’s not the criminal. We can see here that only Aidan is telling the truth that satisfies our original assumption that only one suspect is telling the truth. Hence, David is the criminal!

Now comes the interesting part!

To simplify this entire process, we just need to look at the graph of each hypothesis and find the In-degree of the suspect node we are considering for that hypothesis. The In-degree of suspect X would clearly indicate the number of suspects telling the truth when X is the criminal. In the above example, we arrive at the final set: (2, 3, 2, 1) which is the in-degree of nodes (A, B, C, D) respectively, indicating the number of suspects telling the truth when that suspect node is the criminal (which is what we derived earlier). This is extremely powerful! Now, if we knew that two people were telling the truth, we would simply need to look at this set (2, 3, 2, 1) to find out who is the criminal and see that Aidan or Clara or both would be criminals! Similarly, if we knew that 3 suspects were telling the truth, we can conclude that Brandon is the criminal!

Conclusion

In real life cases, it’s not always possible to tell how many suspects are telling the truth (fake alibis etc). But look at how powerful this is. If we had a list of 10, 20 and maybe even 30 suspects, it is possible to significantly narrow down this list of suspects. In fact, advance modifications of such ideas are used indeed used in solving crimes. To conclude, although graph theory can’t replace the work of an actual detective, it can surely make his/her life much easier and provide critical information that is otherwise very hard to see.

Reference:

https://www.ijrte.org/wp-content/uploads/papers/v8i6/F9355038620.pdf