Categories
Uncategorized

Automatic Lane Changing controller Using Human-Like Game Theory

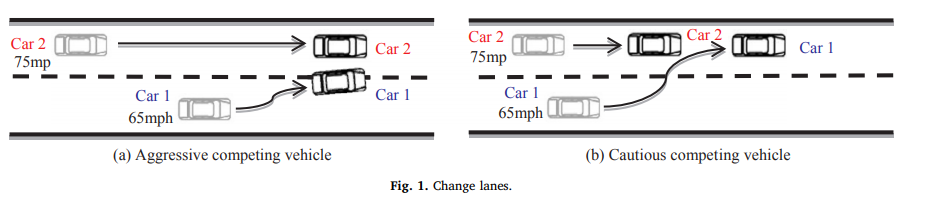
In self driving cars and autonomous vehicles, one of the most important features to implement to make a truly self driving autonomous car in a environment where there are a mix of both self driving and manually driven cars is lane changing. In a lane change, the autonomous vehicle has to predict the actions of the vehicles in the incoming lane and adjust speed and decide on when to commit to the merge. This decision is one that needs to be made before the merge lane ends and is subject to a lot of adjustments and on the fly decisions. An aggressive approach can be potentially dangerous and a cautious approach might impede traffic.

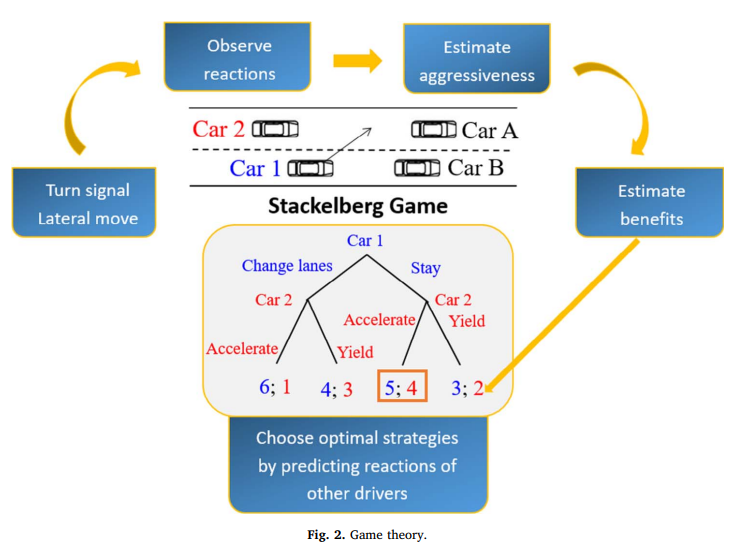
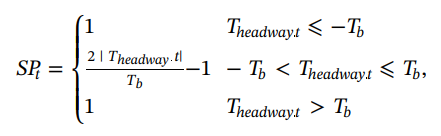
This decision and control can be modeled as a game, in which the payoff is a compilation of several factors, the safety, which is calculated by the rate of change in the safety factor between the time the decision is calculated and the moment, and the safety factor is calculated by the distance between cars as defined by this function:

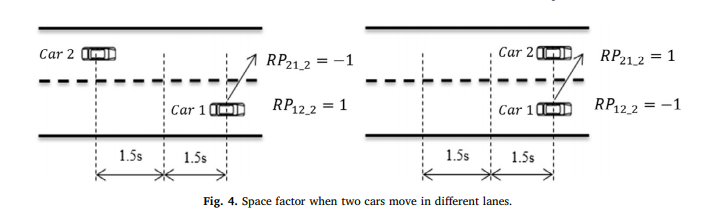
The payoff also factors in the distance between the two vehicles, this payoff also takes into account the time it takes for the vehicle to merge into the destination lane.

The total payoff is a linear combination of the two above payoffs.

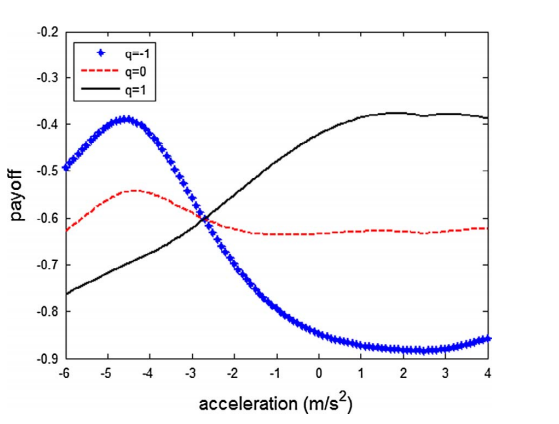
And the payout function can be estimated given the parameters fed to it by the car:

And the game can be solved by the equation:

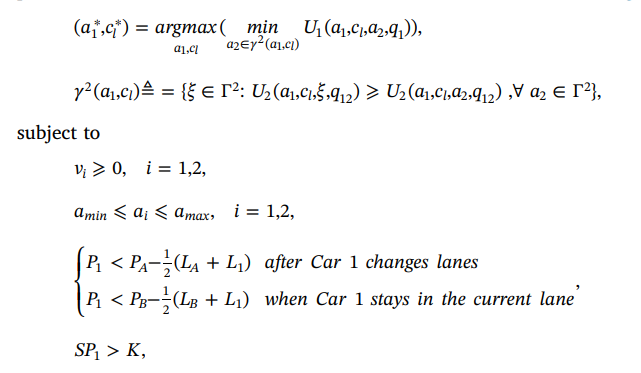
where Ut denotes the total payoff.

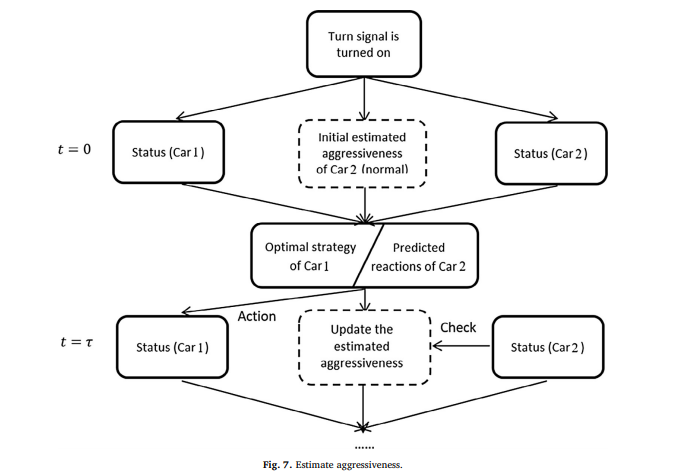
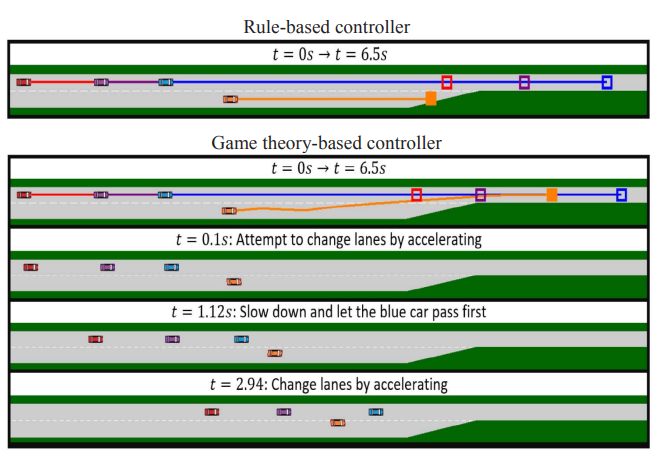
The article then breaks down the lane merging action into a game between two cars. And the payoff of the opposing car can be estimated by the aggressiveness estimate, can let the merging car predict to a extent the behavior car 2 will take.

Citations:

Yu, H., Tseng, H. E., & Langari, R. (2018). A human-like game theory-based controller for automatic lane changing. Transportation Research Part C: Emerging Technologies88(Complete), 140–158. https://doi.org/10.1016/j.trc.2018.01.016

Categories
Uncategorized

Assessing Supply Chain Risk Using Graphs

The Yale School of Forestry and Environmental Studies has mapped the supply chain of five products.

The objects in modern society that we make use of in our day to day lives are made of many different materials. For example, a cellphone is comprised of many parts made from different materials, from the silicone and gold, as well as other rare earth metals that are used to create the microprocessors, as well as various plastics and glass that makes up the screen and casing of the phone. All these various materials are refined, processed, and assembled at different locations worldwide. The institute mapped the supply chains for 5 product platforms: 2 types of solar cells, a turbine blade, a lead acid battery, and a hard drive magnet.

The mapped supply chain of the CdTe Solar cell

The research defines a supply chain “consisting of companies that produce and supply materials and parts and those that transform them into products”. In that sense, the links in a graph can be made based on their supplier-customer relationships.

From analyzing the 5 products the Center for Industrial Ecology has looked at several factors into the risk of portions of the supply chain. For example, companies that are multinational or countries that have a lot of raw material extraction (e.g. mines) often have many production sites and are less likely to be impacted by supply chain disruptions. And materials that are only processed by a small amount of entities are higher risk.

In conclusion, graph analysis can be used to analyze potential risks in manufacturing and identify key parts of the market and supply chain. As well as identify problem areas that are at high risk of disruption and to develop replacement materials for them if the need arises.

Sources:

Nuss, P., Graedel, T., Alonso, E., & Carroll, A. (2016). Mapping supply chain risk by network analysis of product platforms. Sustainable Materials and Technologies, 10, 14-22. doi:10.1016/j.susmat.2016.10.002