Categories
Uncategorized

Among Us Game theory (space mafia)

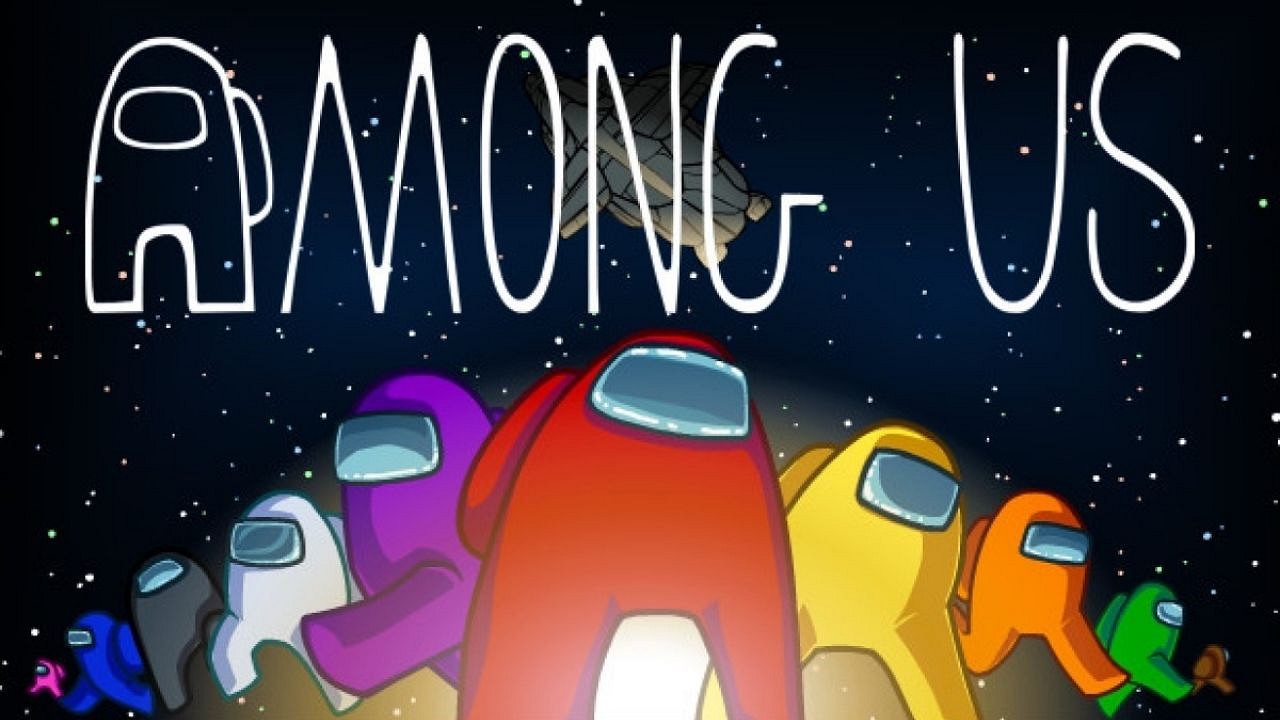
During the covid-19 pandemic, many of us stay home for self quarantine. Among many entertainment choices, a classic mafia style online game called Among Us has topped the charts for the current most played game in 2020. The mafia style game follows the premise of crewmates who are trying to repair the spaceship while imposters pretending to be crewmates slowly eliminate the crewmates before the ship is ready to make their escape. In this game, there exists dominant strategies and payoff matrices for the decisions and actions of crewmates and imposters.

First off, we can examine the utility functions of crewmates who want to perform as many repair tasks around the ship while staying alive. One can argue that different players will value staying alive or speeding through tasks to be more important on an individual basis. For this a common choice crewmates handle are to either stay together in a group, or run off alone to your own tasks. Next we evaluate the perspective of the imposters. Imposters want to eliminate crewmates without being noticed, so crewmates sticking together is bad for them, while crewmates running off alone makes for an easy job. As such, we can relate to game theory and arrive at a payoff matrix that may resemble something like this:

Payoff matrix between crewmates and imposter

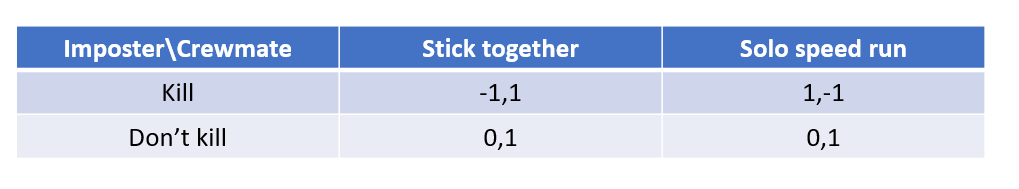
One may find that sticking together is the dominant strategy, yet why is this game not always won by crewmate who possess a dominant strategy against the imposters that do not? The reason may be very well an incentive to cheat among the crewmates. The reasoning being: if others are sticking together, then me running off would let me do repairs faster and not be at risk of getting eliminated by an imposter within the group. Thus another matrix is between crewmates may resemble as follows:

Payoff matrix between large groups of players and a single player

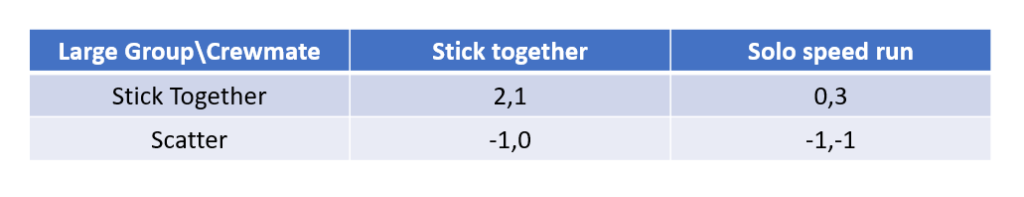
Fortunately for the imposters, they get a chance at always catching someone running off solo because the incentive to cheat a huge cluster brings the Nash equilibrium to scatter large groups. This is in fact the normal behavior of average games where players sometimes only forms small partnerships and travel together as a compromise to both extremes (neither group nor solo). This risks whether or not we trust the partnership on predetermined roles. They can either be an imposter marinating a crewmate for a solid alibi, or they can be crewmates looking for protection:

Payoff matrix for trusting in a partnership without knowing if they’re crewmate or not

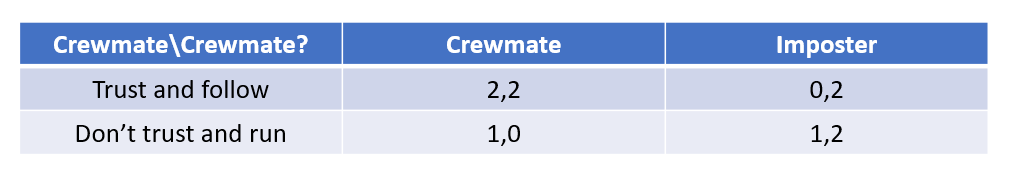
In this event, the column chosen is pre-determined, but we won’t know for sure until it’s too late, making intuition a large portion of the decision making process. Trusting someone who happens to be a crewmate is mutually beneficial, while trusting an imposter could get you eliminated, or even becoming a “third imposter”, someone who spreads misinformation in favor of imposters. This concludes the main decision making aspect of the game where dominant strategies conflict with an incentive to cheat. Do you feel its better to stick together, or would you rather trust nobody?

Sources:

https://medium.com/@kaustubh.q/among-us-and-game-theory-f74c8ac9f05

https://www.theguardian.com/games/2020/sep/29/among-us-the-ultimate-party-game-of-the-covid-era

https://thesportsrush.com/among-us-downloads-among-us-tops-downloads-in-october-2020/

Categories
Uncategorized

Fraud detection through graph network analysis

A company called Ravelin offers services towards wire fraud detection. Wire fraud is defined as crime done electronically; you may know it as stealing credit card information. This is the process by which scammers would acquire credit card information from unsuspecting victims and use them as their own payment methods. Ravelin attempts to mitigate the damages by compiling a database of various data such as persons and spending habits to graph trends. Normal spending behavior may differ from person to person, but it is predictable in sense of a pattern. Ravelin uses this information to build a graph network using nodes and edges. By doing so, the resulting graphs will form trends and patterns which differ between normal activity and those which exhibit malicious activity.

A typical graph structure of user information that would be collected from a real human consumer

One of the graphs may look at what you use your credit card for and connect your credit card transfers as edges to the recipients that are nodes. “Fraudsters” as Ravelin labels them are typically strongly connected component, which is to say they typically know each other, or are using the same methods and tactics. Because they operate similarly with each other their patterns are very distinct but spontaneous. In one example, a spontaneous large amount of orders on multiple computer generated accounts were made to a book store with a shipping address that all lead to the same location. Upon detecting a sudden influx of the exact same transaction, further research found the destination to be a market for illegal goods as well as a forum where the fraudsters planned the whole ordeal.

Other techniques include monitoring growth of a network, since family doesn’t often multiply; their growth is slow in contrast to the fast growing scale in which a scam operation needs to turn a profit. As you may have surmised, placing multiple orders on the same account will look suspicious, while placing multiple purchases on multiple generated accounts will also seem suspicious when paying with the same credit card. These bridges connecting the graph from customer, payment, and location are obvious signs that fraud has taken place. They are easy to spot and typically can be traced back to fraud rings, which are criminals who work together.

Multiple accounts and purchases made over a single device or payment method is a likely sign of stolen credit card information
Multiple accounts generated from a single device to exploit a system by posing as many individual customers

In summary, graph networks are can be used to run analytics and determine the probability in which fraud may be taking place. The connections which exhibit fraud typically form graphs which differ in shape compared to normal user activity. Fraud networks are clustered, grows very quickly, and has smaller number of bridges relative to the size of connected clusters. This makes them easy to detect and narrow down fraudulent cyber activity.

Source: https://www.ravelin.com/insights/link-analysis-and-graph-database-for-fraud-detection