With recent advancement in cryptocurrency, the profit of selling cyber tools and initiating attacks becomes much desirable. And thus led to new pathways for cyber hacking and cybercrime. According to the Center for Strategic and International Studies the estimated annual cost to the world-wide economy from cybercrime is more than $400 billion with a conservative estimate being $375 billion in losses, exceeding the national income of most countries.
In this paper, the authors develop a game theory model consisting of sellers and buyers with sellers competing non-cooperatively in order to maximize their expected profits by determining their optimal product transactions as well as cybersecurity investments.
This paper is on economics of cybersecurity in terms of information asymmetry: not assuming that the sellers are identical nor are they faced with the same cybersecurity investment cost functions. This paper particularly:
- Develop a rigorous framework that captures competition among sellers in an oligopolistic market of non-identical sellers, who identify optimal product quantities as well as optimal cybersecurity investments;
- For the first time, model information asymmetry associated with cybersecurity investments between buyers and sellers of a product;
- This model is not limited to specific functional forms for the seller transaction cost functions and the buyer demand price functions.
- This framework is computationally tractable and supported by both theoretical qualitative results and an algorithm, which enables the exploration of numerous sensitivity analysis experiments.
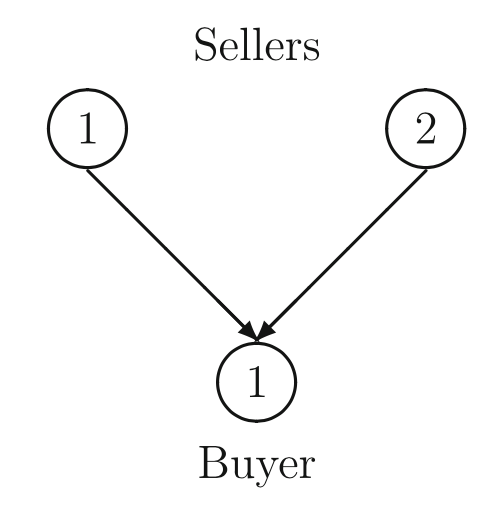
Here is the generic seller-buyer model used in this paper.
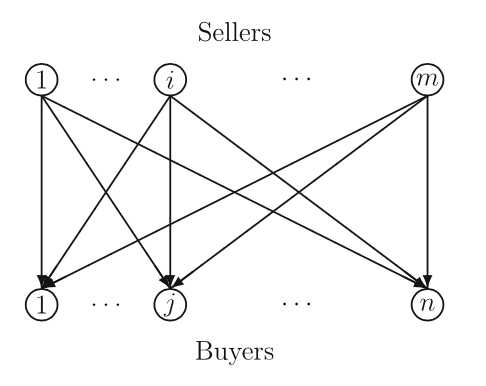
They construct probabilities from the security levels of the sellers, identify the expected financial damages, in the case of a cyber attack, and reveal the expected profit functions of the sellers. The sellers compete non-cooperatively, each one maximizing his expected profit until a Nash equilibrium is achieved.
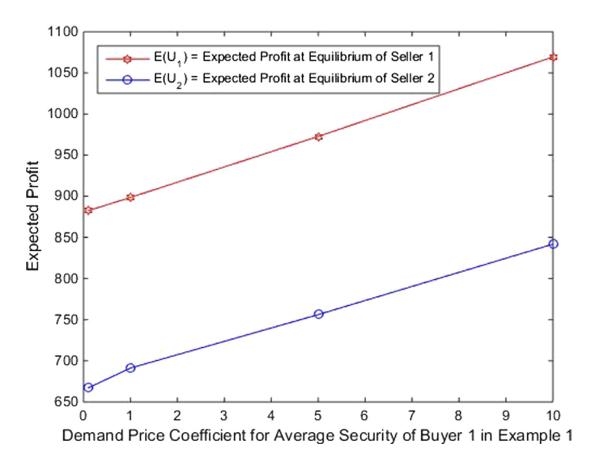
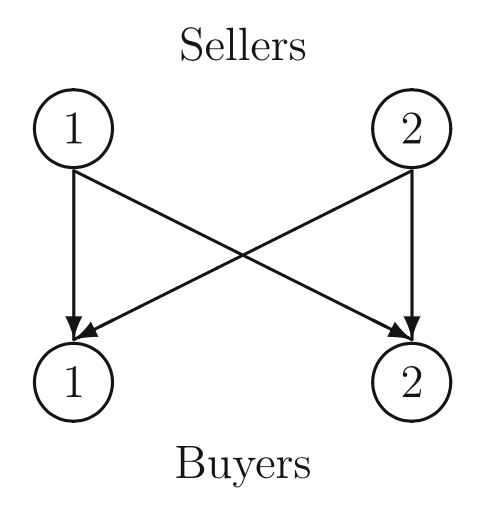
The paper enumerated typical network topologies on this seller-buyer model and calculated the expected profit (calculating equilibrium points) and how number of sellers can affect the profit.
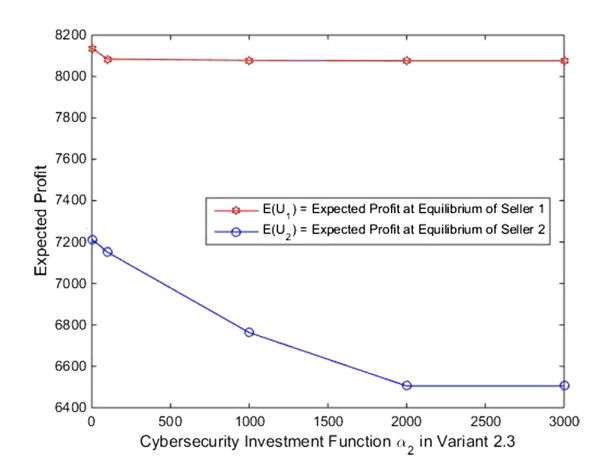
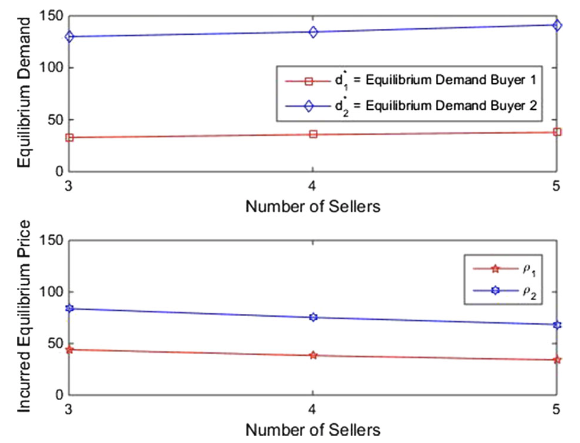
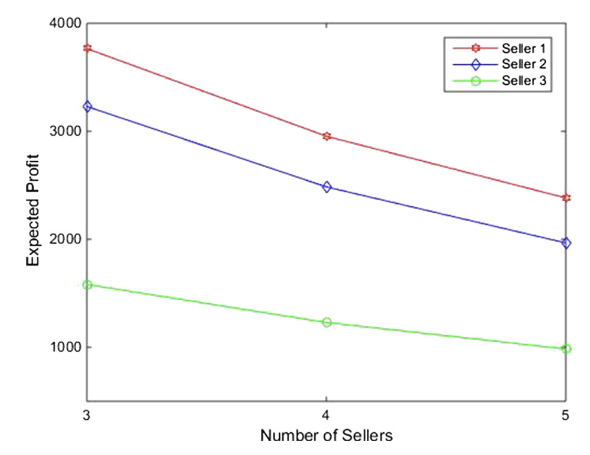
The second figure, for example, could reflect a scenario where Seller 2 has expanded his cyber infrastructure and needs to invest more in appropriate software to protect the network. Seller 2 now has an equilibrium security level that is one quarter of that in Variant 2.3. Interestingly, not only do his expected profits decline but also those of Seller 1 do.
In summary, the computational scheme proposed by this paper has nice features for implementation and results in closed form expressions (both for the product transactions and security levels). This result can be used in security investment analysis to help company make critical decisions.
Reference: A game theory model of cybersecurity investments with information asymmetry https://link.springer.com/article/10.1007/s11066-015-9094-7