As an avid viewer of sports, I am always seeking ways to see how the concepts I learn in class could be applied in evaluating sports performance. Regarding graph theory, the authors Ribeiro, Silva and co have attempted to create a graph-based mathematical model that can better display micro and macro analysis of player performance.
In the piece, the authors first explain why graph theory can be applied to sports. As most sports are cooperative in nature and require the movement of some sort of ball, they are ripe for use in graphs. One of the key fallouts of regularly used statistics for sports that the authors bring up is that they do not properly represent spatial scales (Ribeiro et al., 2017, p.1690). For instance, while passes completed by a player in a soccer game may help in knowing how well a player can pass the ball, it does not reflect how well the player gets the ball down the pitch. A player could complete low risk passes but some may favour a player who makes less passes accurately but gets the ball into scoring position.
For the graphs themselves, the authors present two possible graph types to choose.
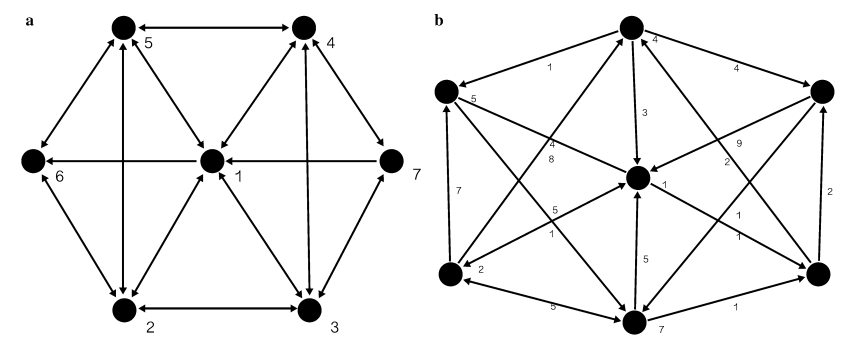
In reference to weighted graphs, the authors mention how graph weight could be relevant in context. For instance, weight could be used as the count of passes made between players in a soccer pitch. Additionally, the authors present an application of graph theory that uses weighted graphs and their associated adjacency matrices to evaluate a soccer team’s passing performance.
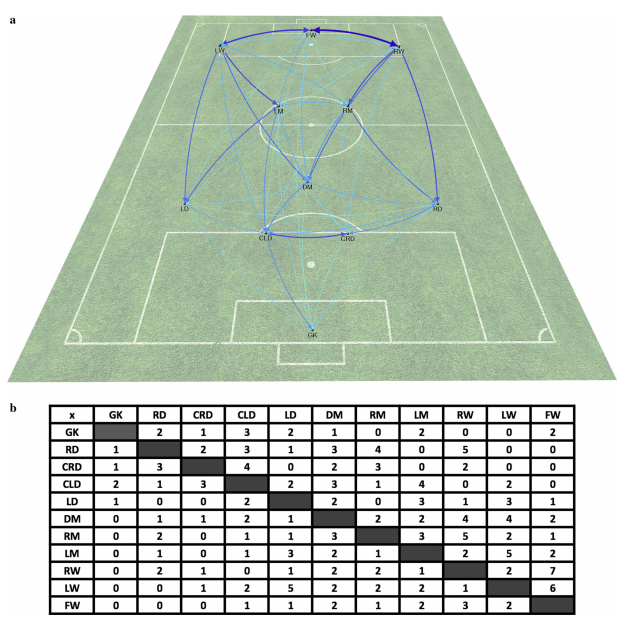
In this example, the authors use nodes to display players and wider edges to demonstrate weights of how often a pass is made between two players. In doing so, the authors display how some common graph calculations could better explain player performance in this context. Degree centrality, for instance, is how many edges that include a node (Ribeiro et al., 2017, p.1694). Using this, we can see in how many passes a player is involved in. Another key value could be the betweenness centrality, which is how often a node appears in the various shortest paths between any pair of nodes (Ribeiro et al., 2017, p. 1694). This helps to show how involved a node/player is in the passing network. By using graph concepts, like node degrees, the authors are showing us the application of graphs in assessing sport performance.
Overall, while the authors demonstrate the effectiveness of graph theory in evaluating a soccer team’s passing network, they also identify some key issues with generalizing their models over different sports. First, it is not easy to use the same node and edge classifications for a sport with little to no passing (Ribeiro et al., 2017, p. 1694). An example that I immediately thought of as I read the piece was American football. Outside of laterals, the majority of passing in the sport is done by the quarterback and so using passes as edges in that graph model may not work as most edges would come from one node.
Another key issue is that their models and the other studies they referred to in their piece do not properly demonstrate the variance of player performance in different situations (Ribeiro et al., 2017, p. 1694). As an example, their models do not display player performance over time (Ribeiro et al., 2017, p. 1694). Regarding this, I think a way to incorporate time into the graphs is to break up the passes done over various periods of time. While this would result in a multitude of graphs, it does give us the opportunity to see how our pass networks differ as time progresses. In the example above with soccer, if a player’s degree centrality falls immensely over time, we would see this as the amount of edges originating from the node decreasing over time. As such, it may make sense for a coach to then substitute the player after a certain amount of time.
I personally found this piece interesting because it gives us an application of graph theory we have not seen in class and it also shows some issues with using graphs to represent other contexts. By showing us how the application of graph theory in sports, it also brings up the importance of properly defining our nodes and edges when creating a mathematical model. While their model works well with models based around passing, there is work needed to be done to properly evaluate other sports networks.
References:
Ribeiro, J., Silva, P., Duarte, R., Davids, K., & Garganta, J. (2017). Team Sports Performance Analysed Through the Lens of Social Network Theory: Implications for Research and Practice. Sports Medicine, 47(9), 1689-1696. doi:10.1007/s40279-017-0695-1
Link: https://link-springer-com.myaccess.library.utoronto.ca/article/10.1007/s40279-017-0695-1